What CISD + IFVG is
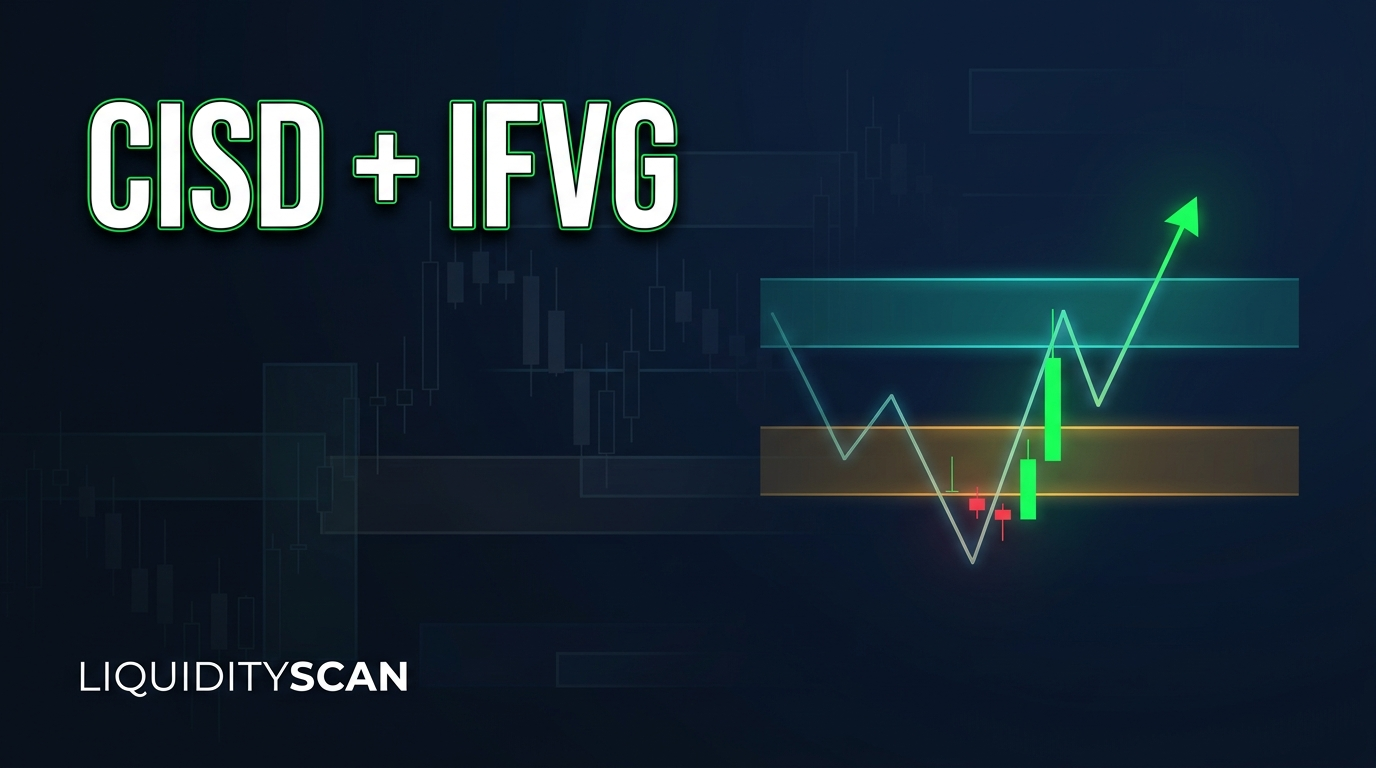
CISD + IFVG is a reversal pattern made of two events that point the same way. The first is a CISD (Change in State of Delivery): a candle closes back beyond the level where the last run of candles into a swing low or high began. The second is an IFVG (inverse fair value gap): an earlier three-candle gap that price closed straight through, so the gap now works in the opposite direction. When the CISD prints while a same-direction IFVG is active, the side that pushed price into the extreme has lost its last run of candles and a zone it was expected to defend.
Both ideas come from ICT (Michael J. Huddleston). You can find the pattern by hand on one chart, or let a scanner check hundreds of markets each time a candle closes. This article covers the price logic first, then the LiquidityScan scanner built for it.
The two parts, candle by candle
CISD: the run into the extreme is undone
Picture a 4H sell-off that ends in a swing low after four down-close candles in a row. The open of the first candle in that run is the CISD level. While price stays under it, the candles that delivered price lower are still intact. A bullish CISD is the first candle that closes above that open. A wick through the level does not count.
The bearish version mirrors it: a run of up-close candles into a swing high, then a close below the open of the first candle in that run. If the term is new, start with what CISD means in ICT trading. A CISD often prints before a swing-based structure shift, because its level sits closer to the extreme than the last swing point. The difference is laid out in CISD vs market structure shift.
IFVG: a gap that failed and flipped
A fair value gap is a three-candle formation where the wicks of the first and third candle do not overlap, leaving a strip of price that only the middle candle traded. During the sell-off above, a bearish gap forms when the first candle's low sits above the third candle's high. Sellers are expected to defend that gap if price comes back to it.
If a candle instead closes up through the whole gap, the gap is inverted. It is now a bullish IFVG: a zone where buyers are expected on a pullback. Again the close decides it. A wick that pierces the gap and falls back leaves an ordinary, partly filled FVG. The full rules are in the inverse fair value gap guide.
Why traders want both
Each part alone is thin evidence. A CISD after a one-candle run takes almost nothing to trigger. An inverted gap alone says one seller's zone failed, while price may still sit under the level where the run began. Together they describe the same shift twice, from two different measurements. The IFVG also gives a defined zone to watch on a retrace, which is more useful than acting on the close of an already stretched candle.
| Step | Bullish CISD + IFVG | Bearish CISD + IFVG |
|---|---|---|
| Move into the extreme | A run of down-close candles into a swing low | A run of up-close candles into a swing high |
| Gap in the way | A bearish FVG above the low | A bullish FVG below the high |
| Inversion | A candle closes above the gap, which becomes a bullish IFVG | A candle closes below the gap, which becomes a bearish IFVG |
| CISD | A candle closes above the open of the first candle in the down-run | A candle closes below the open of the first candle in the up-run |
| Idea is wrong when | Price closes back below the IFVG or trades through the swing low | Price closes back above the IFVG or trades through the swing high |
When the pattern fails
- Nothing was taken at the extreme. The reversals ICT traders look for start after price runs an obvious pool of stops: a prior swing low, equal lows, a session low. A CISD + IFVG in the middle of a range, with no liquidity sweep before it, is often plain rotation.
- The higher timeframe disagrees. A bullish 1H pattern inside a daily downtrend is often only a pullback. It can run a short distance and then be overrun by the next daily leg.
- Weak ingredients. A tiny gap or a run of one small candle meets the definition and means little. Look for displacement: large bodies leaving the swing.
- The move is already spent. Both conditions need closes, so by the time they are met price may be far from the swing. Invalidation sits at the swing, so a late entry carries a wide stop. Waiting for a return to the IFVG shortens that distance, and sometimes price never returns.
The pattern also says nothing about how far the new move will go. Targets come from your own read of where liquidity rests.
How to find CISD + IFVG on LiquidityScan
LiquidityScan is scanning software, not a signal service. It reports what closed candles did across 600+ pairs and leaves the decision with you. The CISD + IFVG scanner is one of its eight classic scanners, which are free to read with no time limit.
- Create a free account at liquidityscan.io/register. Pages inside the app need one, and no card is asked for.
- Open the scanner directly, or go through All Scanners, where every card shows a live count and how its pattern works.
- Choose the market mode. Crypto perpetuals, forex (72 instruments including gold and silver) or TradFi (stocks, indices and commodities). All 15 scanners run on all three.
- Choose the timeframe. This scanner covers 1H, 4H and 1D. It has no 5m or 15m.
- Read the signals. Detection happens on closed candles only, so a 4H signal exists only after a 4H candle has closed beyond the CISD level. Nothing is reported from a candle that is still forming.
The Waiting Room is the one place in the app that shows whether a setup would fire if the current candle closed now. How to use that state is covered in seeing ICT setups one close before they trigger.
What a signal shows
- CISD: the level where the last run of candles into the swing low or high began. The signal fires when a candle closes back beyond it. The interface also writes MSS for this break.
- IFVG: the earlier three-candle gap that price closed straight through. The range shown covers all three candles, so it is wider than the strict gap between the first and third wicks. Treat it as the zone and refine it yourself.
- MARKER: a heads-up on the chart with no entry, stop or targets. It clears after 50 candles.
- KZ: the signal candle opened inside the 12:00–16:00 UTC kill zone, a window of heavier trading. This tag exists on 1H and 4H only.
- New York session flag: the breakout candle opened between 09:00 and 14:00 New York time.
Cutting the list down
- Watchlist. Star a market on the scanner page and follow all its signals in one place. The Free plan holds one watchlist of five markets.
- X-Ray. Look up one market across every scanner to see which way its higher timeframes lean before trusting a 1H marker. Free includes one X-Ray a day.
- Pulse (Starter and above). A filter that keeps only the scanner signals RSI also confirms: oversold for longs, overbought for shorts. CISD and CISD + IFVG share one Pulse card, with a selector that limits it to CISD signals that also have the inverse gap. The reasoning is in RSI confirmation for ICT signals.
- Alerts (Starter and above for the classic scanners). In My Alerts you choose the scanner, markets and timeframes. Delivery is browser push, Android push and an in-app bell. There is no Telegram delivery. The choices are walked through in setting alerts that do not spam you.
The nested version, a lower-timeframe CISD inside a higher-timeframe one, is a separate premium scanner covered in multi-timeframe CISD (CISD+).
Four checks before you act on a marker
- What did the swing take? Scroll left. If the low behind a bullish signal ran a prior low or a set of equal lows, the reversal has a reason. If it took nothing, be sceptical.
- Which way does the higher timeframe lean? A 1H signal in the direction of the 4H and daily lean reads as a pullback ending. Against that lean it is a counter-trend idea and should be treated as one.
- Where is price relative to the IFVG now? If price has already run far from the zone, the marker is information, and a trade may only exist on a retrace.
- Where is invalidation, and what size does that distance allow? Measure from your planned entry to the level that proves the idea wrong, then size from that. The position-size calculator under Tools estimates size from balance, risk and the entry-to-stop distance.
Frequently Asked Questions
What is CISD + IFVG in ICT trading?
It is a CISD, a close back beyond the level where the last run of candles into a swing began, that prints while an inverse fair value gap in the same direction is active. Traders read it as a reversal of the leg that just ended.
Is the CISD + IFVG scanner free?
Reading it is free. It belongs to the eight classic scanners on the Free plan, on 1H, 4H and 1D, once you have a free account. Alerts on the classic scanners and the Pulse filter start on the Starter plan.
Which timeframes does CISD + IFVG work on?
The pattern can be drawn on any timeframe. The LiquidityScan scanner for it covers 1H, 4H and 1D. On lower timeframes the gaps are smaller and the runs shorter, so each signal is easier to trigger and easier to break.
Does the scanner give an entry and a stop loss?
No. Each signal is a marker with no entry, stop or targets. A common reading is to watch a retrace into the IFVG and treat a close back through it, or a trade through the swing extreme, as invalidation. Where you enter and how much you risk is your own decision.
Does CISD + IFVG work on forex and indices, or only crypto?
The price logic is the same on any liquid market. On LiquidityScan the scanner runs in all three modes: crypto, forex and TradFi. Exotic forex pairs have wide spreads and gappy prices, so the app keeps them on a separate tab.
What is the difference between CISD + IFVG and CISD+?
CISD + IFVG is a CISD paired with an inverted gap. CISD+ is a different scanner: a lower-timeframe CISD inside a same-direction higher-timeframe one. It belongs to the premium scanners.
Related reading
- How to Scan for CISD (Change in State of Delivery) Setups — the plain CISD scanner, for when you want the shift without the gap condition.
- Displacement in ICT: Reading Institutional Intent — how to judge the quality of the move behind a signal.