What stacked order blocks are
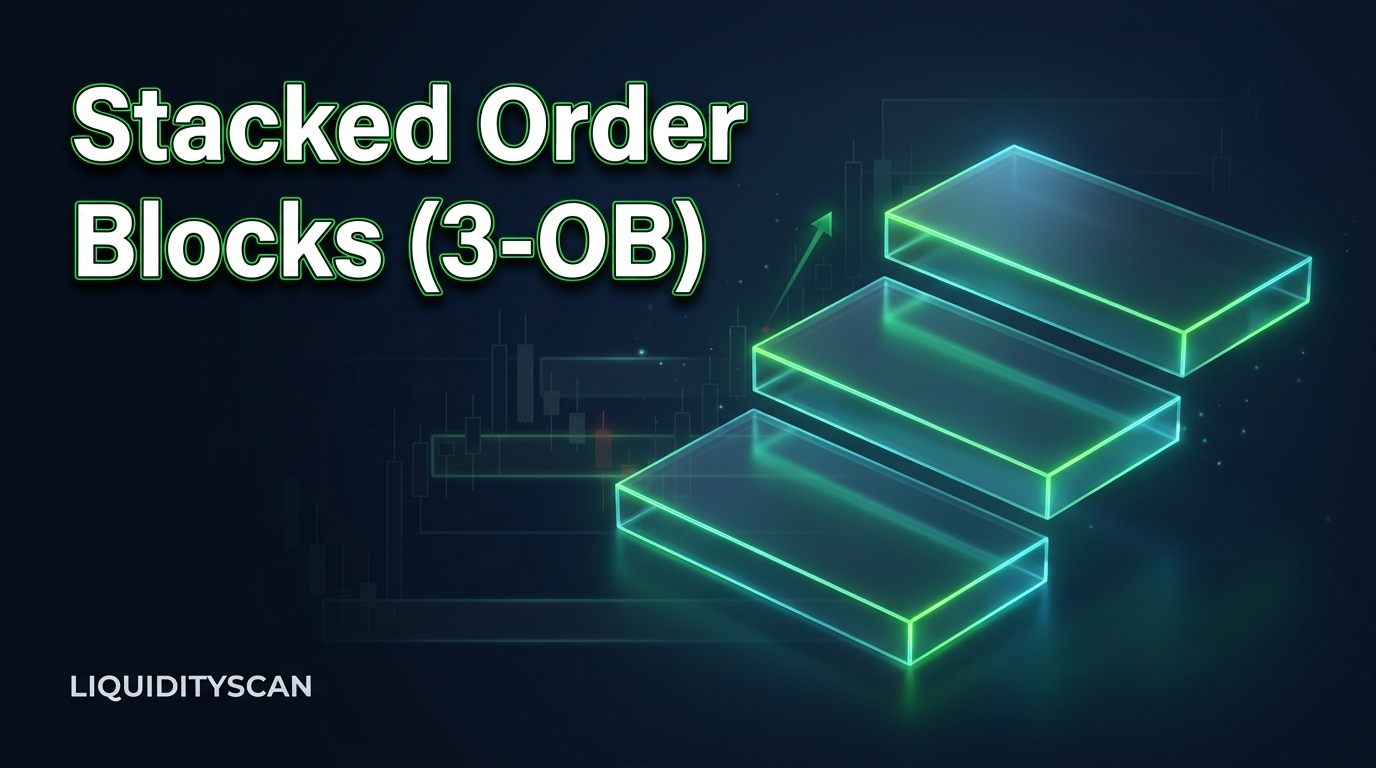
Stacked order blocks are order blocks that form one after another in the same direction, each new one sitting above the last in an advance or below it in a decline. An order block is the last opposing candle before a strong move: the final down-close candle before price pushes up, or the final up-close candle before it drops. When several print in a row, each pullback was short and was taken back straight away, so traders read the stack as continuation of the move already under way, not as a reversal.
The phrase is used loosely. Some traders mean three separate zones spread along a trend leg; others mean a tight cluster on one level. LiquidityScan's 3-OB scanner, which the platform describes as three stacked order blocks stepping price in one direction, runs on one strict rule that you can check on any chart by looking at three candles. This article covers that rule, what it tells you and what it leaves out, and how to read the scanner page. If the base idea is new to you, start with what an order block is and why price returns to it.
The three-candle rule behind 3-OB
The legend on the scanner page defines the pattern in three lines:
- Bullish 3-OB: three candles in a row, green, red, green, with the third closing above the high of the middle candle.
- Bearish 3-OB: three candles in a row, red, green, red, with the third closing below the low of the middle candle.
- The OB zone: the full range of those three candles, from the lowest low to the highest high.
Picture a 4H chart that is moving up. Candle one closes green. Candle two closes red: a one-candle pullback, and the down-close candle a classic order block is built on. Candle three closes green, and its close sits above candle two's high. Everything sellers did during the red candle has been taken back by the close. A wick that pokes above the red candle's high and then closes back under it does not qualify. The close is the whole test.
The bearish version is the mirror: a red candle, a green bounce, then a red candle that closes under the low of the bounce candle.
Two consequences follow. Because the zone covers all three candles, it is wider than a single-candle order block, which matters when you measure risk. And LiquidityScan detects on closed candles, so a 3-OB appears only after candle three has closed. A third candle that is trading above the middle candle's high but has not closed is not a signal.
What a 3-OB tells you and what it leaves out
What it tells you is narrow and useful: the opposing side had one candle and lost all of it by the next close. Inside a trend, that is a pullback that failed almost at once, which is why LiquidityScan files the pattern under continuation. If you are unsure which kind of setup the market is offering, the guide to telling continuation setups from reversal setups covers the distinction.
What it leaves out:
- The bigger picture. Three candles cannot tell you whether the higher timeframe is trending, ranging or turning.
- A liquidity sweep. The rule does not ask for a sweep, meaning a wick through a level where stops rest followed by a turn back. A block confirmed by a sweep is what the separate Order Blocks scanner looks for, described in how to find strong order blocks that took liquidity.
- Candle size. The legend's rule is about colour and where the third candle closes. Whether the candles show displacement, meaning large one-sided bodies, is for you to judge on the chart.
- A trade plan. Every 3-OB on LiquidityScan is a marker: a heads-up on the chart with no entry, stop or targets.
How to scan for 3-OB on LiquidityScan
3-OB is one of the eight classic scanners, which are free to read on every plan. Pages inside the app need a free account, so sign up first; no card is asked for.
- Open the scanner. Go to the 3-OB scanner. You can also reach it from All Scanners, where all 15 scanners sit on one page with live counts and each card shows how its pattern works.
- Choose the market mode. Crypto perpetual contracts, Forex (72 instruments, metals included) or TradFi (stocks, indices and commodities). All 15 scanners run on all three modes, so the same three-candle rule is applied everywhere.
- Pick a timeframe. 3-OB covers 1H, 4H, 1D and 1W. There is no 5m or 15m version: on LiquidityScan only Fair Value Gaps and CISD+ have those two intraday timeframes, on the Base plan and above.
- Read the labels. 3-OB is the pattern, bullish or bearish. OB is the zone, the full range of the three candles. MARKER says the signal is a chart heads-up with no entry, stop or targets. KZ means the signal candle opened inside the 12:00–16:00 UTC kill zone, a window of the day when activity is concentrated; the tag applies to 1H and 4H only. The complete guide to ICT kill zones explains why session timing matters.
- Check the three candles yourself. Find the middle candle, mark its high or low, and confirm the third candle closed beyond it. This also shows you how large the candles are, which the label alone does not.
- Mind the marker's life. A 3-OB marker clears after four candles, so a marker you saw earlier may have cleared when you come back.
- Keep the markets you care about. Star a market on the scanner page and it joins your Watchlist, which follows its signals in one place.
- Decide how you want to hear about it. Reading is free; a push when a 3-OB fires is not. Alerts on the eight classic scanners start on the Starter plan, and you set them in My Alerts by scanner, market and timeframe. Delivery is browser push, Android push and an in-app bell; there is no Telegram delivery. Price alerts are part of the Free plan, so you can still set one at the edge of a zone.
- Optional: add the RSI filter. Pulse, from Starter up, passes a scanner signal only when RSI confirms it: oversold for longs, overbought for shorts. 3-OB is one of the six scanners it can filter, but it is opt-in and off by default. Think about what that does to a continuation pattern: a bullish 3-OB passes only after RSI has been stretched to the downside, which means after a deep pullback and not in the middle of a smooth trend. The article on RSI confirmation for ICT signals explains the two modes.
LiquidityScan is software and education, not a signal service. A 3-OB marker is context for your own decision.
3-OB, OB+ and MOB: three order block scanners compared
Three LiquidityScan scanners deal with order blocks, and they answer different questions.
| 3-OB | Order Blocks (OB+) | Mega Order Block (MOB) | |
|---|---|---|---|
| What triggers it | Green-red-green or red-green-red, with the third candle closing beyond the middle candle's high or low | A strong order block confirmed by a liquidity sweep | Two or more order blocks nested inside a higher-timeframe anchor block |
| Group | Classic 8 | Premium 7 | Premium 7 |
| Who can read it | Every plan, Free included | Free shows a live count only; setups open from Starter | Free shows a live count only; setups open from Starter |
| What you get | A marker and the three-candle zone; no entry, stop or targets | Grades OB+ and OB++ (OB++ belongs to Pro) | Grades MOB and MOB+ (MOB+ belongs to Pro) |
| Scanner alerts from | Starter | Base | Base |
If your idea of stacking is blocks on different timeframes sitting inside one another, that is the MOB scanner's subject, covered in order blocks nested inside a higher-timeframe zone.
Reading a 3-OB in context: an example in words
Take a market whose daily chart is making higher highs and higher lows, and whose last daily candle closed above the high of the one before it. That close is the condition LiquidityScan's Bias scanner reads as bullish for the next candle; the article on scanning daily bias before the session goes through it. Price then drifts lower for a few 4H candles and prints green, red, green, with the third close above the red candle's high. That is a bullish 4H 3-OB.
Four questions turn the marker into a decision or a pass:
- Does the higher timeframe agree? Here it does. A bullish 3-OB against a bearish daily read is a weaker situation.
- Is there room? Find the next obvious swing high above, where buy stops rest. If candle three closed just beneath it, much of the move may already be spent.
- Where is the idea wrong? The zone runs from the lowest low of the three candles to the highest high. A close below the bottom of it means the block that was meant to hold did not. That line is yours to draw; the scanner draws no stop.
- Chase or wait? Acting at the close of candle three puts the whole three-candle range between you and the invalidation. Waiting for price to trade back into the zone shortens that distance, but price may never come back. Neither is correct by default. Either way the distance sets the size, which the position size calculator walkthrough covers.
When stacked order blocks fail
Three candles are easy to print for no reason. These are the usual ways the pattern misleads:
- Inside a range. Green-red-green and red-green-red appear constantly in sideways price. With no trend there is nothing to continue. Read how to tell trending structure from consolidation before trusting any continuation marker.
- Against the higher timeframe. A bullish 1H 3-OB inside a 4H or daily decline may be nothing more than the bounce before the next leg down.
- Straight into liquidity. If the third candle closes just under equal highs or an old swing high, the push may exist to reach those stops, and the turn can come right after they are taken.
- Late in the leg. After a long run with no real pullback, one more green-red-green can be the last push, and the zone sits far from any level where the trend idea would be wrong.
- Tiny candles. Three small candles can satisfy the colour-and-close rule without showing any urgency.
None of this is unique to 3-OB. The same logic applies to every block, and why order blocks fail goes through the invalidation rules traders most often skip.
Frequently Asked Questions
What does 3-OB mean in trading?
On LiquidityScan, 3-OB is a three-candle order block pattern: green, red, green with the third candle closing above the middle candle's high (bullish), or red, green, red with the third closing below the middle candle's low (bearish). The zone is the full range of the three candles.
Are stacked order blocks a continuation or a reversal pattern?
Continuation. The pattern shows a one-candle pullback that was erased at the next close. A bullish 3-OB that prints against a falling higher timeframe is still labelled bullish, so checking the context is your job.
Is the 3-OB scanner free?
Reading it is free. 3-OB is one of the eight classic scanners on the Free plan, and you only need a free account to open the page. Push alerts on classic scanners start on the Starter plan.
Which timeframes and markets does the 3-OB scanner cover?
1H, 4H, 1D and 1W, across the Crypto, Forex and TradFi modes. There is no 5m or 15m 3-OB; only the Fair Value Gaps and CISD+ scanners have those timeframes, on Base and above.
Does a 3-OB signal give an entry, stop loss and targets?
No. Every 3-OB is a marker with no entry, stop or targets, and it clears after four candles. The Daily Recap covers the classic scanners, but target statistics exist for SuperEngulfing only, so there are no outcome numbers for 3-OB.
Related reading
- Propulsion Block: The ICT Continuation Setup — another way ICT traders frame a block that forms inside a move already under way.