The short answer: same mechanism, different fuel and timing
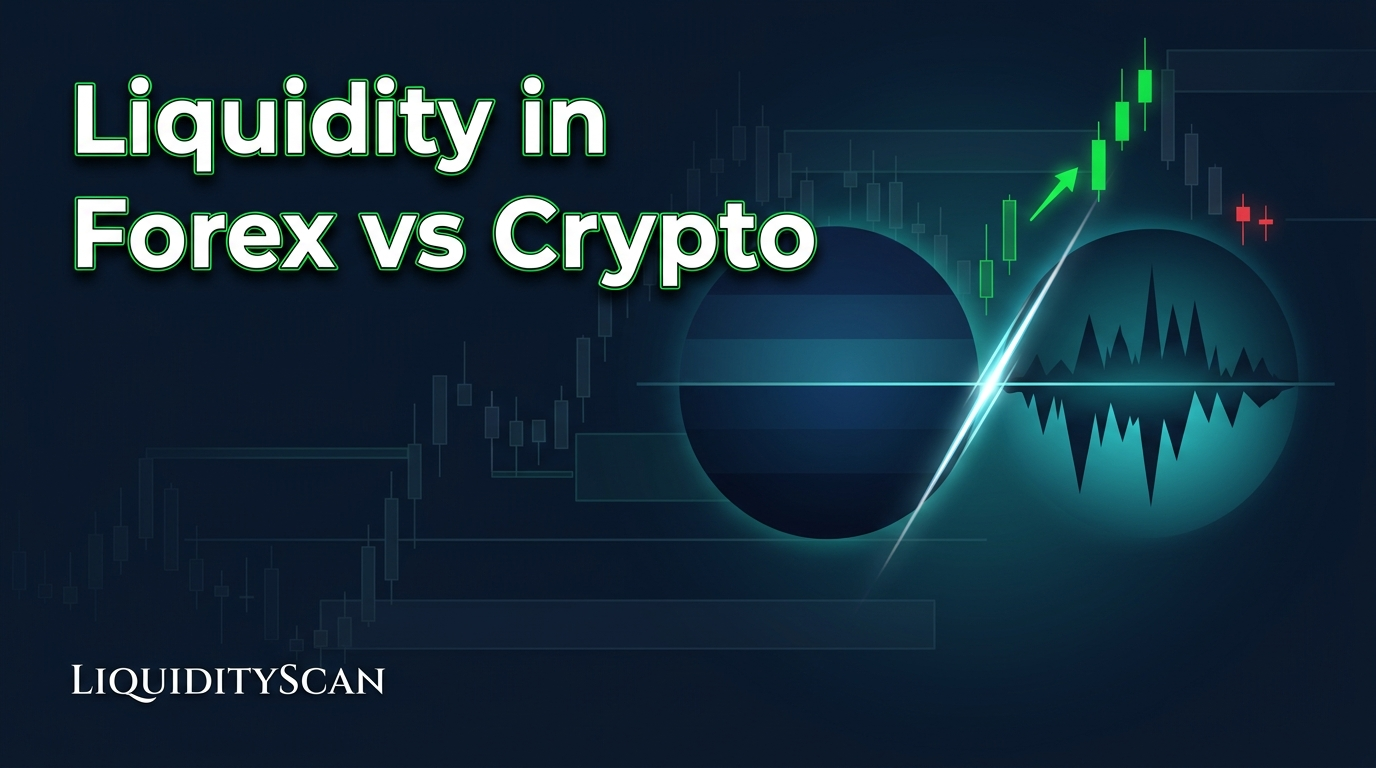
A stop hunt works the same way in forex and crypto: price trades past a level where stop orders are clustered, fills them, and closes back on the other side. The differences are in the surroundings. In forex, liquidity builds around session highs and lows, the hunts cluster near the London and New York opens, and the spread decides whether your stop is touched. In crypto, the market never closes, leveraged perpetual contracts add forced liquidations to the stop orders, and the wicks are often deeper and can arrive at any hour, weekends included.
That changes three practical things: which levels you mark, when you expect the run, and how much room a stop needs.
What a stop hunt actually is
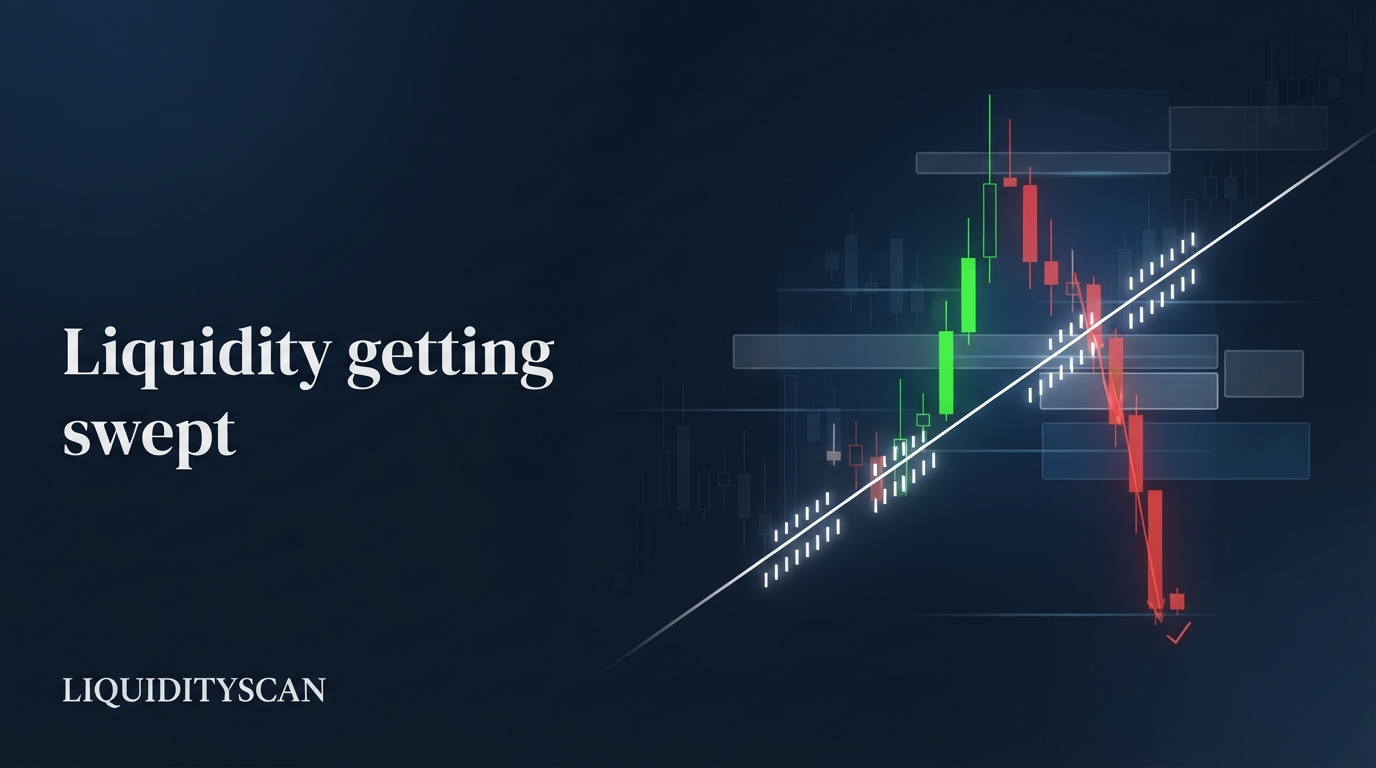
Liquidity, in ICT terms, means resting orders. Above a swing high sit buy stops: shorts protecting their positions and breakout traders waiting to get long. That cluster is buy-side liquidity, and the sell stops under a swing low are sell-side liquidity; the guide to identifying buy-side and sell-side liquidity shows how to mark both. A stop hunt, also called a liquidity sweep, is a candle that trades through one of those levels, triggers the orders, and then closes back inside the range it just left.
The logic is about filling size. A participant who wants to sell a large amount needs many buyers at once, and a pile of buy stops above equal highs is exactly that. Nobody is targeting your individual order. Your stop simply sits where everyone else's does. If that framing is new, the article on whether stop-loss hunting is real goes deeper.
Forex: liquidity is organised by the clock
Spot forex has no central exchange. Banks, brokers and liquidity providers quote each other, so there is no single order book and no single official price. What gives the market its shape is time: Asia, London and New York hand over to each other every day, and the whole market shuts for the weekend.
That rhythm decides where stops accumulate. The levels forex traders lean on are mostly time-based:
- the high and low of the Asian session, usually the quietest stretch of the day;
- the previous day's and previous week's high and low;
- equal highs or lows formed inside one session;
- round numbers, where orders gather out of habit.
It also decides when the run happens. A kill zone is a session window when volume concentrates, such as the first hours of London or New York. The textbook forex stop hunt is London trading through one side of the Asian range before the day's real direction shows, or New York doing the same to London's high or low.
Picture a major pair that spent the Asian session in a narrow range. Early in London, a 1H candle pushes above the Asian high, where shorts had their stops, and then closes back below that high with a long upper wick. The level has been swept. What has to happen next is displacement: a strong candle down that closes below the level where the last run of up candles into the high began. Until that prints, all you have is a wick.
The forex quirk: spread
Most forex charts plot the bid price. A buy stop, the kind that protects a short, fills at the ask, which is higher by the spread. So a short can be stopped out above a high that the chart never shows being touched. Spreads widen around the daily rollover, around major news and on thin pairs, which is one reason exotic pairs behave differently from majors and crosses: a wick there can be a widening spread and not a run on real orders. And because every broker has its own feed, a sweep that is clear on one chart can be a near miss on another.
The weekend adds one more case. Price can open on Sunday beyond Friday's high or low without ever trading through it. That is a gap, and it needs its own reading; see how to read the Sunday open and the weekend gap.
Crypto: liquidity is organised by leverage
Crypto trades around the clock on centralised exchanges, and much of the activity is in perpetual contracts: futures with no expiry date, traded with leverage. Leverage is what changes the stop hunt.
When a leveraged position runs out of margin, the exchange closes it at market. A liquidated long is a forced sell; a liquidated short is a forced buy. So under an obvious low there are two layers of sell orders: the stops traders placed on purpose, and the liquidation prices of longs who used too much leverage. When price reaches the first layer, the selling can push it into the second, and each forced close pushes it a little further. That chain is why crypto sweeps often leave long wicks that travel well past the level before anything reverses.
The levels themselves are familiar: swing highs and lows, equal highs and lows, the previous day's and week's extremes, round numbers. What is missing is a closing bell. There is no overnight pause in which a clean range forms, so traders borrow reference points: the daily candle boundary on their chart, the weekend range, or the forex session windows. Whether those windows carry over is a fair question, covered in do kill zones apply to crypto.
Picture a perpetual contract that drifted sideways over a weekend and printed two almost equal lows. On a 1H candle, price drops through both lows, keeps falling as long positions are forced out, then recovers and closes back above them. The reading is the same as in forex: sell-side liquidity has been taken, and the next thing needed is a displacement candle up. The difference is that it can happen on a Sunday when order books are thin, and the wick can run far deeper than the range it came from.
The crypto quirk: venue and trigger price
Each exchange has its own order book, and a perpetual contract can trade at a slightly different price from spot. A wick that takes a low on one venue may stop short of it on another. Many exchanges also let a stop trigger on either the last traded price or a mark price, a reference price used for liquidations, so a spike in last price can hit one trader's stop and miss another's. Small-cap coins make all of this louder: thinner books mean deeper wicks, and a wick on its own tells you less.
Forex vs crypto stop hunts side by side
| Feature | Forex | Crypto |
|---|---|---|
| Trading hours | Session-based, closed at weekends | Continuous, no close |
| Where stops cluster | Asian range, previous day and week extremes, session equal highs and lows | Swing and equal highs and lows, previous day and week extremes, weekend range |
| What fuels the run | Stop orders, helped by widening spreads | Stop orders plus forced liquidations of leveraged positions |
| When it tends to happen | Around the London and New York opens and news releases | Any hour, thin weekend hours included |
| Wick character | Often a shallow poke on majors, wider on crosses and exotics | Often deep, deepest on small-cap coins |
| Data quirk | Bid-price charts; broker feeds differ | Exchange feeds differ; last price vs mark price |
| Gaps | Sunday open can gap past a level | No session gaps on a continuous market |
Reading the sweep: what has to happen next
The confirmation logic does not change between markets. What changes is how patient you need to be.
- Mark the level first. A sweep only means something at a level you could name before price got there: a session high, a prior day's low, a pair of equal lows.
- Wait for the close. The candle must trade through the level and close back inside. A candle still forming beyond the level is not a sweep yet; it may close out there and become a breakout.
- Look for the shift. After the close back inside, price should displace away. Two common confirmations are a CISD (change in state of delivery: a candle closes back beyond the level where the last run of candles into the swing began) and an MSS (market structure shift: a close beyond the most recent swing point against the prior move). The comparison of which of the two confirms a reversal first helps you pick one.
- Know the invalidation. If price closes beyond the swept level and the next candle holds there, read it as a breakout. For the reversal idea, the extreme of the sweep wick is the line: once price trades through it, the idea is wrong. The piece on telling a liquidity sweep from a breakout covers the grey cases.
In forex, the sweep and the shift often complete inside one session window, so a sweep that has produced no displacement by the end of the kill zone loses weight. In crypto, a first wick is sometimes followed by a second run at the same side before the turn. Waiting for the structure shift costs some price, but it filters out the wick that was only the first leg.
Where the read goes wrong
- Labelling every wick in hindsight. A wick at a level nobody was watching is just a wick.
- Ignoring the higher timeframe. In a strong downtrend, lows get taken because price is going lower. A wick under a low followed by a BOS (break of structure, a close beyond the prior swing in the trend's direction) is continuation, not a hunt.
- Trusting a spread wick. On an exotic pair or at rollover, the spike may exist on your broker's feed only.
- Expecting every flush to reclaim. A liquidation cascade driven by real news can run through several levels and not come back.
- Copying stop distances across markets. A buffer that suits a forex major is usually too tight for a small-cap perp, and a crypto-sized buffer on a major wrecks the risk-to-reward.
- Reading too much into it. A sweep tells you liquidity was taken. It does not tell you how far price will go afterwards.
How to find liquidity sweeps in both markets on LiquidityScan
LiquidityScan's Liquidity Sweep scanner looks for the event described above: a stop-hunt wick beyond a level, then a reversal. It is one of the seven premium scanners, and like all 15 scanners it runs on every market mode in the app: Crypto (perpetual contracts), Forex (72 instruments across majors, crosses, exotics and metals) and TradFi. The same definition is applied to a forex major and a crypto perp, so you can compare how sweeps look in each by opening the forex view and the crypto view. Pages inside the app need a free account, which you can create here.
- Closed candles only. A sweep is reported after the candle has closed, never from one still forming, which matches the wait-for-the-close rule.
- What each plan shows. On Free, the premium scanners show a live count of setups, not the setups themselves. Starter opens all 15 scanners to browse. Alerts on the Liquidity Sweep scanner belong to the Base plan and above, delivered by browser push, Android push and an in-app bell.
- Timeframes. Most scanners work on 1H, 4H and 1D. Only Fair Value Gaps and CISD+ also have 5m and 15m, so this is not where you look for sweeps on the smallest intraday charts.
- Exotics are kept apart. In Forex mode, exotic pairs sit on a separate tab and are left out of alerts unless you pick them, because of their wide spreads and gappy prices.
- The reclaim is counted. A detection is labelled with a higher and a lower timeframe and with how many candles the reclaim took.
Two neighbours are worth knowing. The Asia Range Sweep scanner covers the session version: an Asian-range liquidity sweep plus reversal, aligned to a daily bias. And Confluence (dual and triple setups from the Base plan, ordered sequences on Pro) includes a recipe that pairs a 1H liquidity sweep with a same-direction CISD. LiquidityScan is software, not a signal service: a detection is context for your own decision, never an instruction to trade.
Frequently Asked Questions
Are stop hunts more common in crypto than in forex?
They happen in both, and this article does not put a number on either. Crypto sweeps are easier to notice because the wicks are often deeper and the market runs through nights and weekends. Forex sweeps are usually smaller and tied to session opens, so they are easy to miss if you are not watching those windows.
Why are crypto wicks longer than forex wicks?
Mostly leverage. Behind the ordinary stops sit the liquidation prices of leveraged positions, and each forced close adds a market order in the same direction. Thin order books, especially on small coins and at weekends, let that selling or buying travel further before it is absorbed.
Why was my forex stop hit when the chart never touched it?
Most charts show the bid price, while a buy stop fills at the ask, which sits higher by the spread. When the spread widens, for example at rollover or around news, the ask can reach your stop even though the plotted high stays below it.
Do forex session times matter for crypto stop hunts?
As context, not as a rule. Crypto has no session close, so there is no clean overnight range to run. Activity still tends to rise during European and US hours, and sweeps can appear then, but they also appear when no forex session is open.
How do I confirm a stop hunt before acting on it?
Wait for the candle that took the level to close back inside, then look for displacement the other way: a CISD or a market structure shift. If price closes beyond the level and holds there instead, treat it as a breakout.
Does the LiquidityScan Liquidity Sweep scanner work on forex pairs?
Yes. All 15 scanners run on the Crypto, Forex and TradFi modes. Liquidity Sweep is a premium scanner: Free shows a live count, Starter opens it to browse, and alerts on it start on the Base plan.
Related reading
- Order Blocks in Forex vs Crypto: The Key Differences — the same two-market comparison applied to the zones price returns to after a sweep.
- Liquidity Sweep Then Structure Shift: The Stop-Hunt-to-Reversal Sequence — the full sequence from the wick to the confirmation, step by step.
- How to Scan for Liquidity Sweeps and Stop-Hunt Reversals in Real Time — a closer look at finding sweeps with a scanner instead of chart by chart.
- Best ICT Model for Crypto and for Forex: Which Setups Carry Over and Which Don't — which entry models survive the move between the two markets.