▸ LIQUIDITYSCAN RESEARCH
The Blog
Institutional analysis for ICT and Smart Money traders — order flow, liquidity, structural patterns.
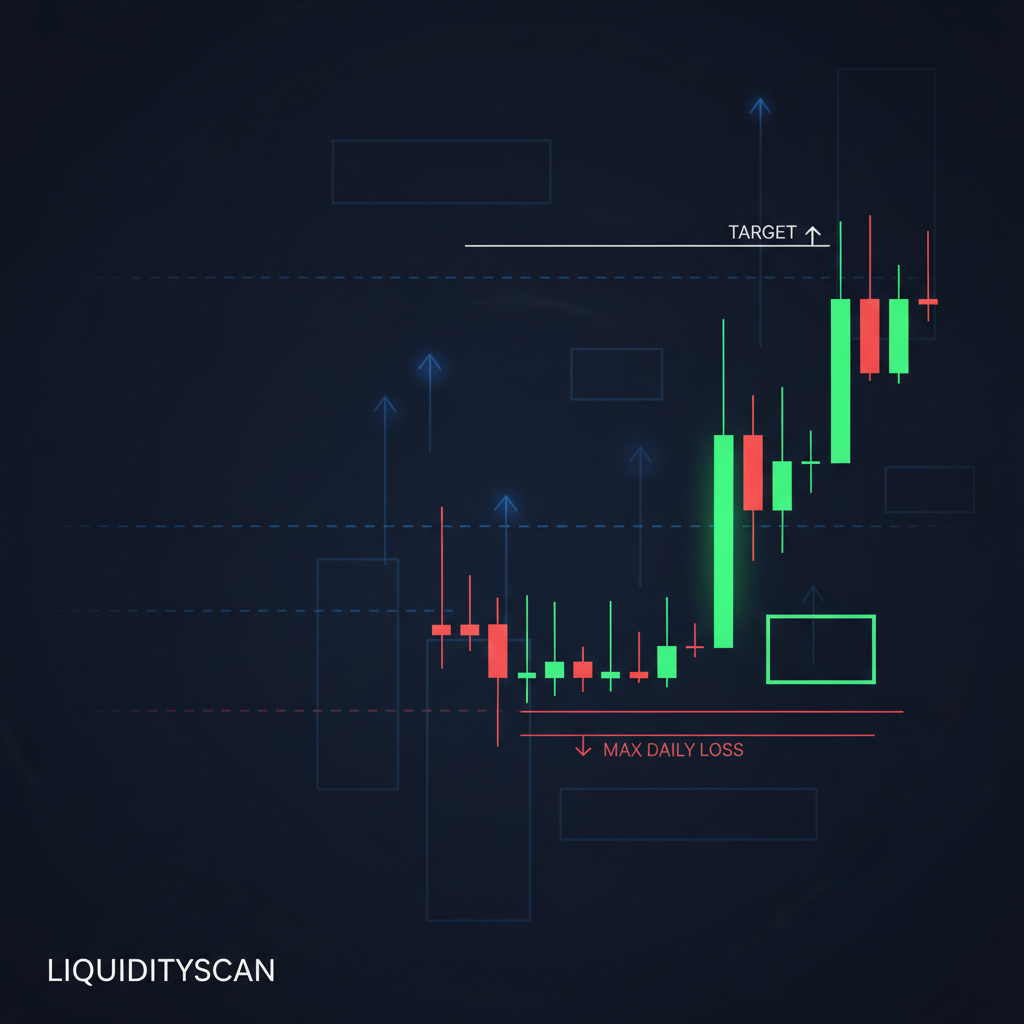
ICT Prop Firm Strategy: How to Pass the Challenge
Passing a prop challenge with ICT is a rules problem, not a setup problem. Match your model to the firm's drawdown math and trade less.
 Hayk Muradian·
·6 min
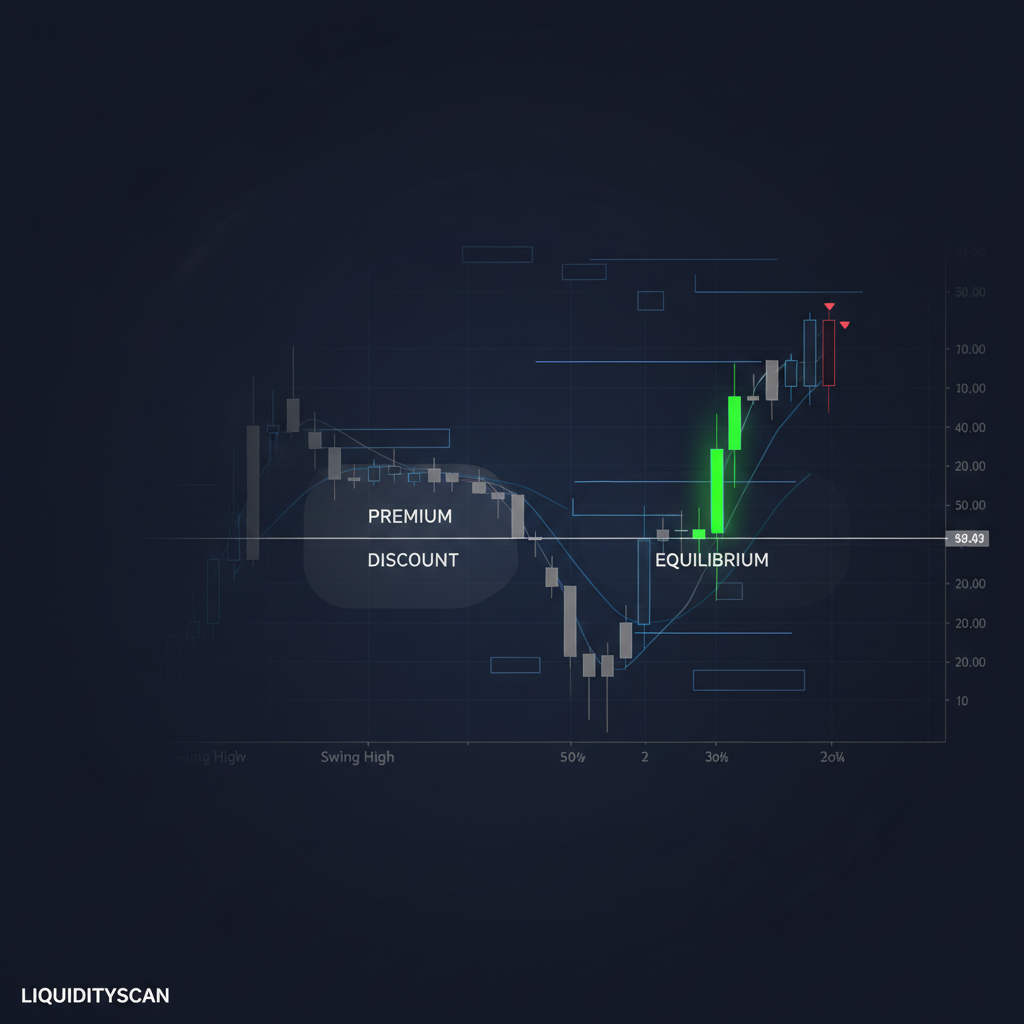
How to Draw Premium & Discount Zones (ICT Guide)
Premium and discount zones start with one correct swing high and swing low. Get the dealing range right and the 50% line does the rest.
Hayk Muradian·
·5 min
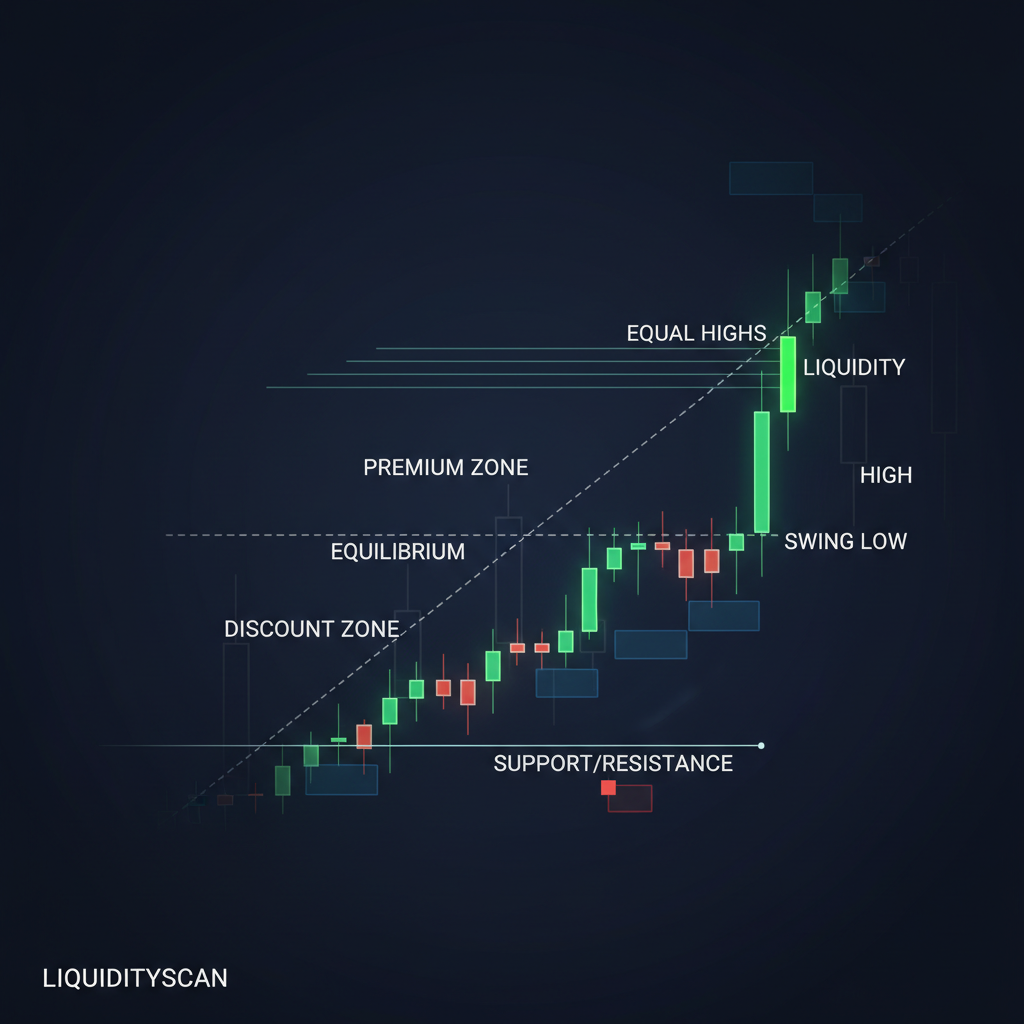
Premium & Discount vs Support & Resistance (ICT)
Support and resistance is horizontal memory. Premium and discount is a valuation model tied to the dealing range and the algorithm behind it.
Hayk Muradian·
·5 min
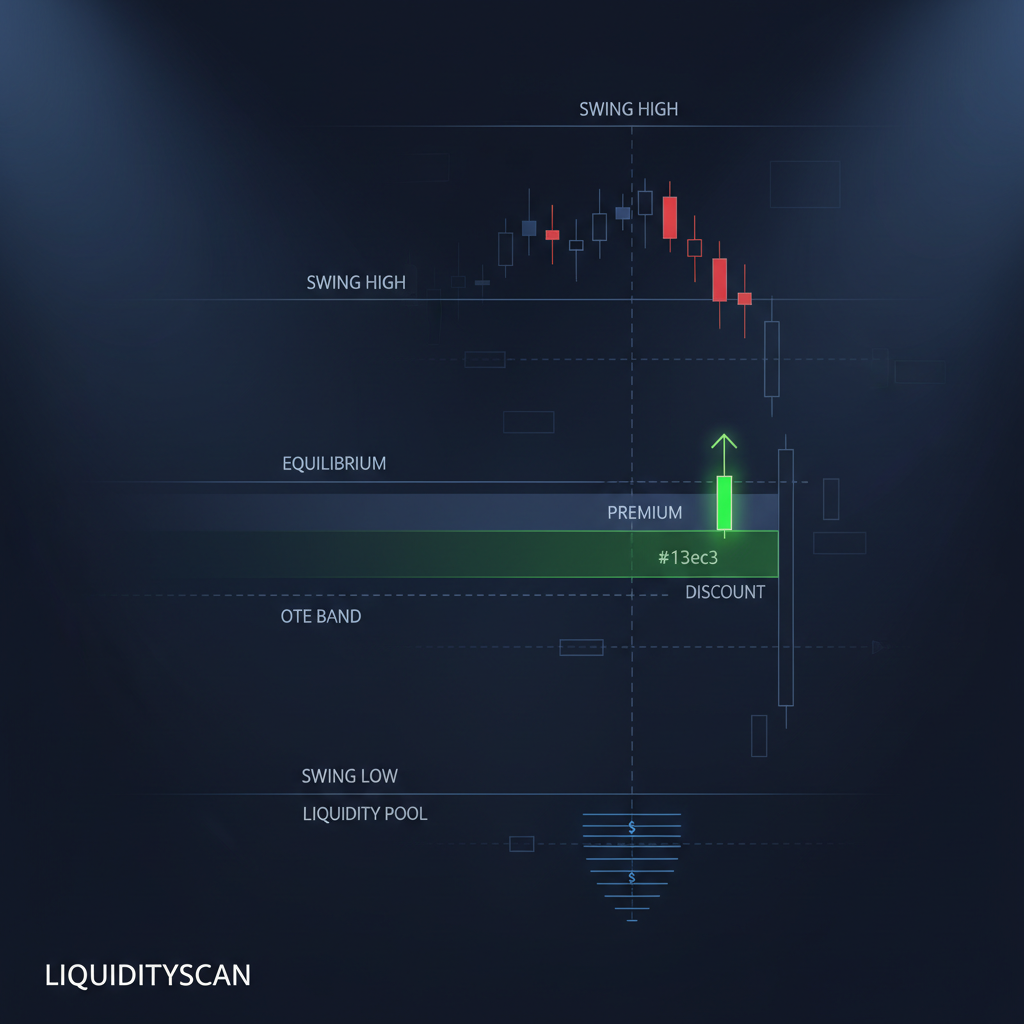
Equilibrium vs OTE: The Right ICT Entry Level
Equilibrium is the 50% of a range; OTE is the 62-79% zone. Here's exactly when each is the smarter entry.
Hayk Muradian·
·5 min

CHoCH vs MSS: Stop Confusing These Two
CHoCH and MSS are not synonyms. One flags a warning inside structure; the other confirms intent with displacement. Here's the precise line between them.
Hayk Muradian·
·5 min

Evolution of ICT Concepts: A Timeline of Key Models
ICT didn't arrive fully formed. It grew from loose liquidity theory into mechanical entry models — and each step solved a real problem.
Hayk Muradian·
·6 min
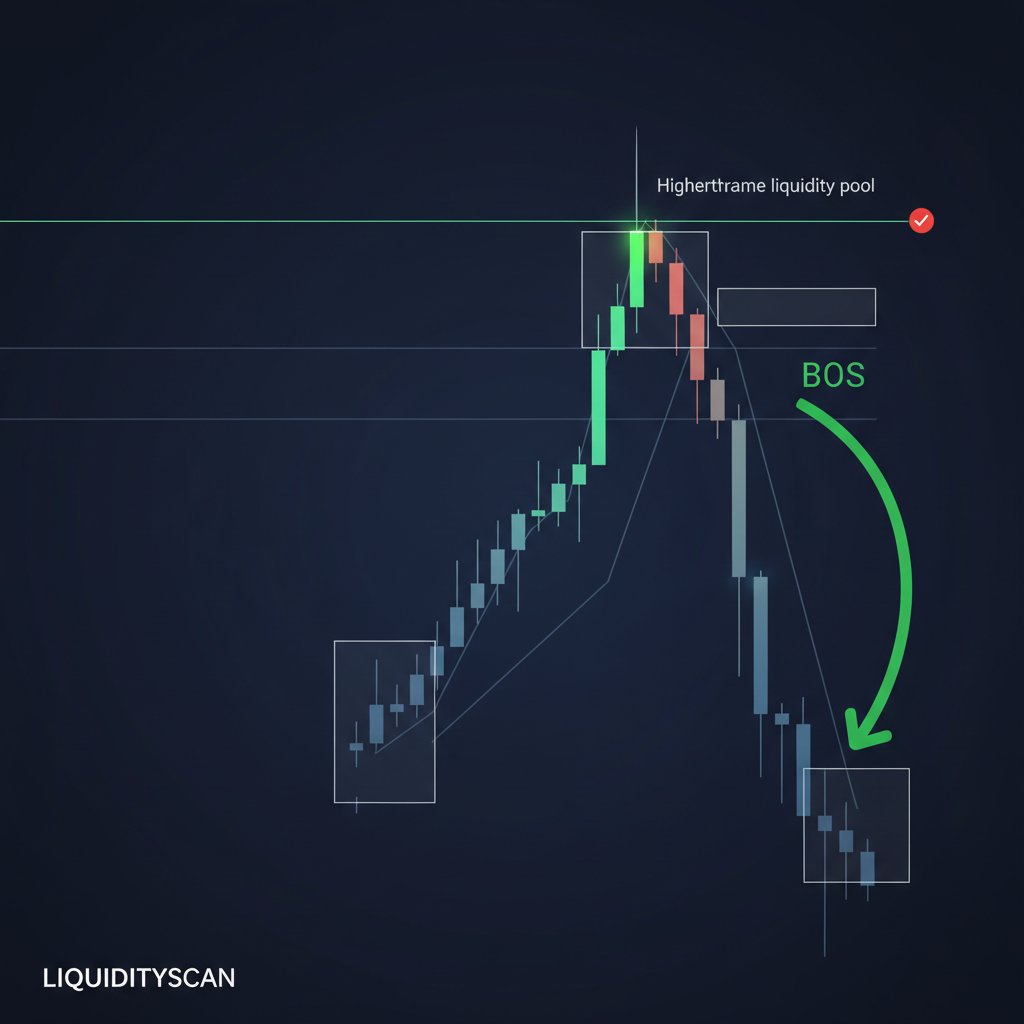
Is Order Block Strategy Profitable? A Data Look
Order block trading can be profitable, but the edge lives in context and R-multiples, not in the rectangle you drew on the chart.
Hayk Muradian·
·5 min
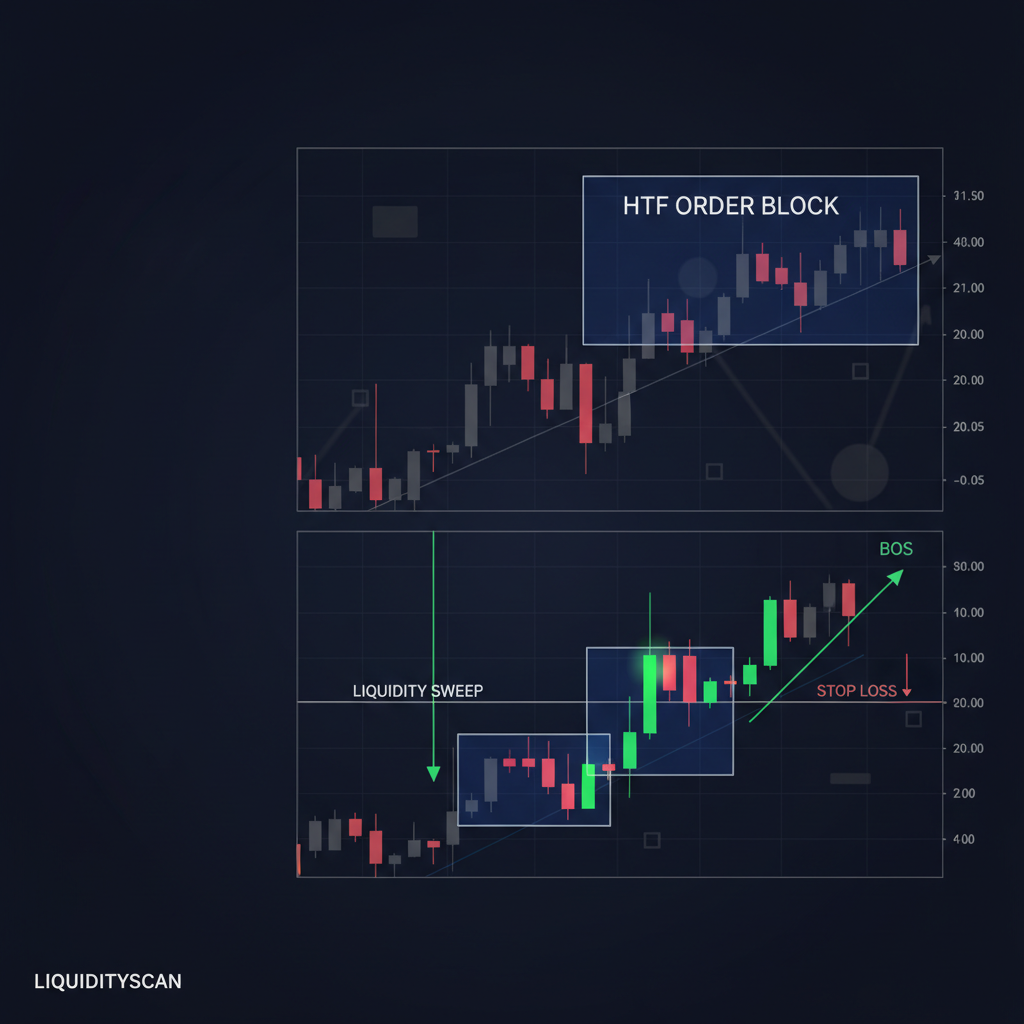
The "Best" Order Block Timeframe Is a Myth — Here's What Works
The best timeframe for an order block isn't one chart — it's a pairing. The HTF marks the zone, the LTF times the entry.
Hayk Muradian·
·5 min
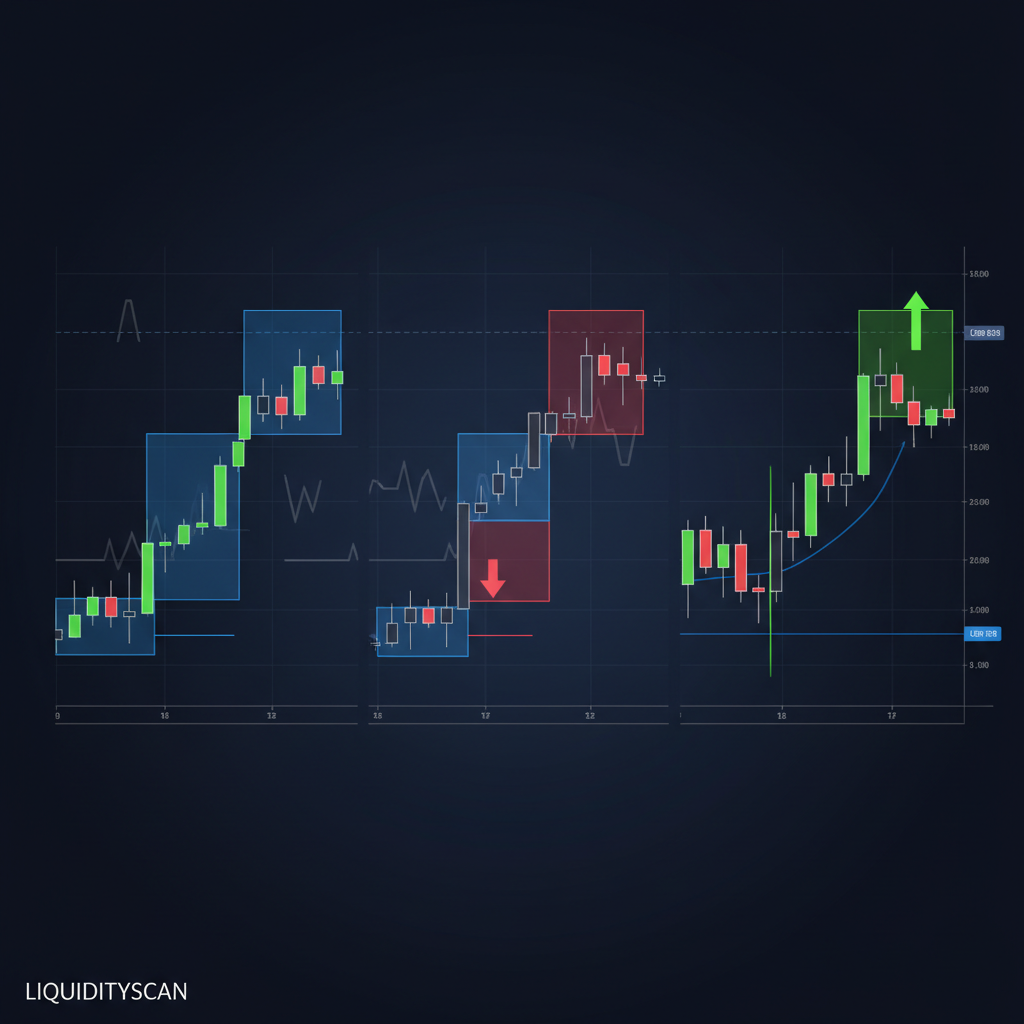
3 High-Probability Order Block Entry Models
Three order block entry models with defined triggers, invalidation, and confluence — no discretion, just rules you can backtest and repeat.
Hayk Muradian·
·5 min
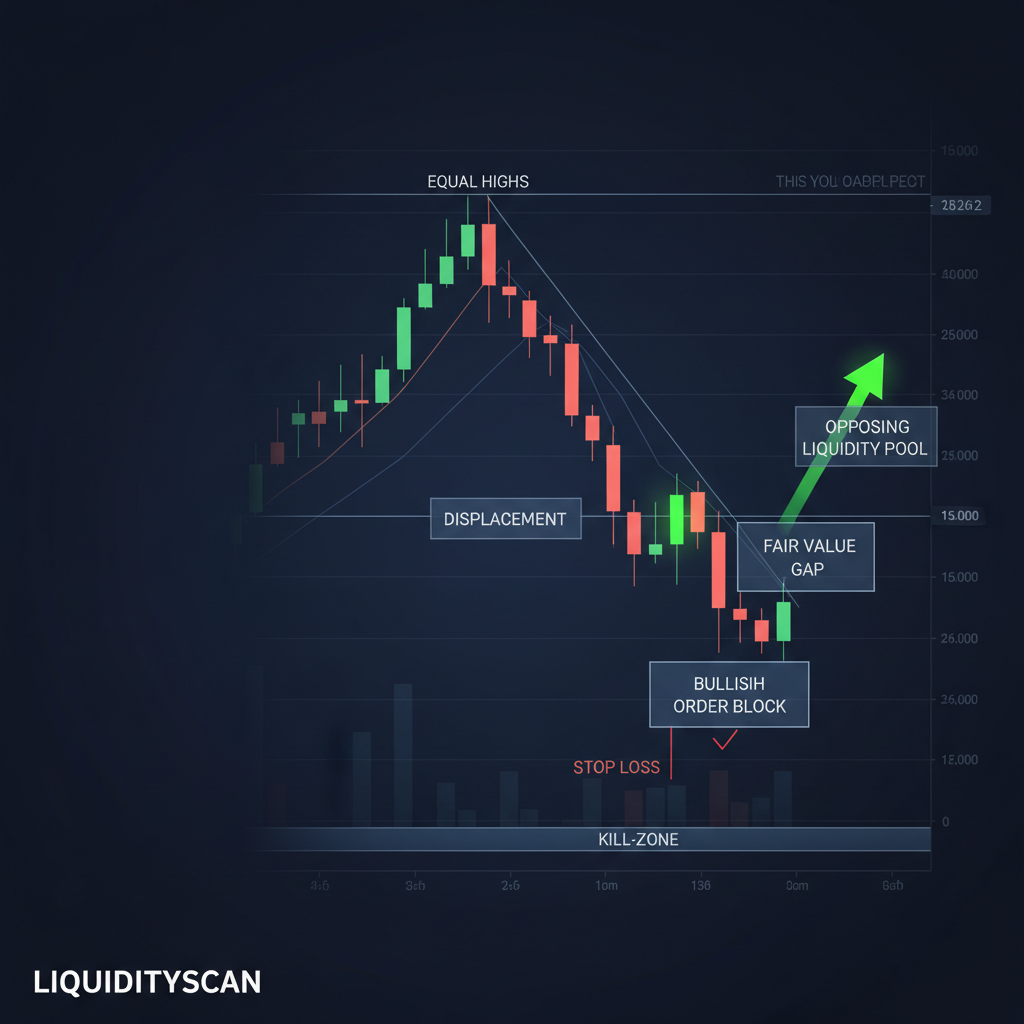
The ICT Trading Strategy, Explained Without the Hype
ICT isn't a single setup. It's a repeatable method for reading where institutions push price next — bias, liquidity, arrays, time, entry.
Hayk Muradian·
·5 min

Stop-Loss Hunting Explained: Is It Real and How to Avoid Getting Swept
Yes, stop-loss hunting is real, but not because anyone is watching your order. Price gravitates to where stops cluster because large orders need that resting liquidity to fill. Here is how to place stops that survive.
Hayk Muradian·
·10 min
The Liquidity Sweep into OTE: A Classic ICT Reversal Setup
The liquidity sweep into OTE is one of ICT's cleanest reversals: price runs a liquidity pool, reverses, then retraces into the 62-79% Optimal Trade Entry zone of the new impulse leg. You enter at a deep discount or premium with the sweep as confluence and invalidation.
Hayk Muradian·
·10 min
The A+ Setup: Order Block + FVG Confluence Strategy
The strongest ICT entries occur where an Order Block and a Fair Value Gap overlap. The OB marks the institutional origin; the FVG marks the precise imbalance to fill. Together they stack into one tight, high-confluence entry zone.
Hayk Muradian·
·10 min

The Art of Confluence: Stacking Edges for High-Probability ICT Setups
SMC confluence trading is the practice of stacking multiple independent edges — bias, location, a liquidity sweep, a structure shift, a PD-array entry, timing — at the same price and time, so no single weak signal decides the trade.
Hayk Muradian·
·10 min
How to Map Market Structure Top-Down: A Step-by-Step Method
To map market structure, work top-down: mark the HTF swings first, read the trend, find the dealing range and draw on liquidity, then drop to the LTF only around your point of interest. HTF sets bias; LTF times entry.
Hayk Muradian·
·10 min
How Many Losses in a Row Is Normal? Losing-Streak Probability Explained
Long losing streaks are not a broken edge — they are guaranteed by probability. A 50%-win system over 200 trades will likely hit a 7-plus streak; a 40%-win system should expect 10. Here is the math, and how to survive it.
Hayk Muradian·
·11 min

How to Trade the Power of Three on the Daily Candle
To trade the Power of Three on the daily candle, anchor to the daily open, wait for the manipulation leg to sweep liquidity against your HTF bias, then enter on the reversal back through the open toward the opposite draw on liquidity.
Hayk Muradian·
·10 min

The Universal ICT Entry Checklist: One Framework for Every Model
Every clean ICT entry passes the same seven checks, no matter the model. This universal ICT entry checklist turns bias, location, liquidity, time, confirmation, risk, and invalidation into a fast pre-trade filter that kills impulsive trades before they cost you.
Hayk Muradian·
·10 min
The 'One Setup' Strategy: How to Master a Single ICT Model for Consistency
A one setup trading strategy means specializing in a single, mechanically defined ICT model and trading it hundreds of times until you know its every nuance. Depth beats breadth: one setup traded 500 times builds an edge that ten setups traded 50 times each never will.
Hayk Muradian·
·10 min

Which ICT Model Should You Trade? A Decision Framework
The right ICT model is the one that fits your schedule, market, and temperament — not the one with the loudest hype. Pick by constraint, master one to consistency, then add.
Hayk Muradian·
·10 min

Risk-to-Reward vs Win Rate: Which Matters More for Profitability?
Win rate vs risk reward is a false choice. They multiply into one number, expectancy, and profitability lives there. But for most retail traders, raising average R is easier and more robust than lifting win rate.
Hayk Muradian·
·10 min
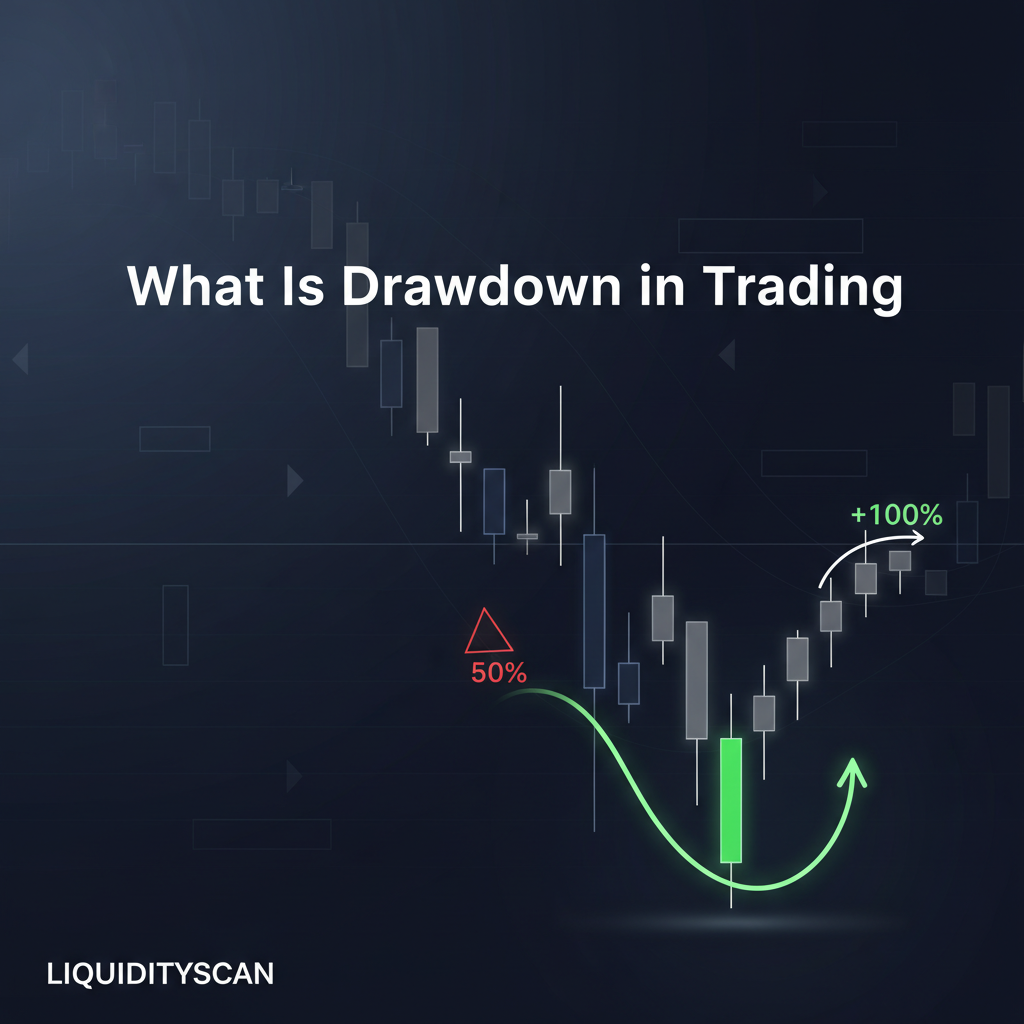
What Is Drawdown in Trading and How to Recover From It
Drawdown is the peak-to-trough decline in your account equity, measured as a percentage. The deeper it gets, the more asymmetric the recovery: a 50% drawdown needs a 100% gain just to break even.
Hayk Muradian·
·10 min

What Is Trading Expectancy and How Do You Calculate It?
Trading expectancy is the average amount you can expect to win or lose per trade over a large sample. Positive expectancy means an edge; win rate alone tells you almost nothing.
Hayk Muradian·
·10 min
What Is a Good Risk-to-Reward Ratio for ICT Trades?
There is no universal "good" risk-to-reward ratio. What matters is pairing R:R with your real win rate to get positive expectancy. ICT setups typically aim 1:2 to 1:5 because structural stops make asymmetric payoffs possible.
Hayk Muradian·
·10 min

Trading Psychology for ICT Traders: Mastering Discipline and Emotion
Two traders run the identical ICT model and get opposite results. The difference is not the setup; it is execution under emotion. Trading psychology is the edge that survives drawdown.
Hayk Muradian·
·10 min
How Much Should You Risk Per Trade? The 1% and 2% Rule Explained
Most professional traders risk 0.5-2% of account equity per trade, and 1% is the common default because it lets you survive a long losing streak intact. Here is the survival math behind that number and how to set your own.
Hayk Muradian·
·10 min
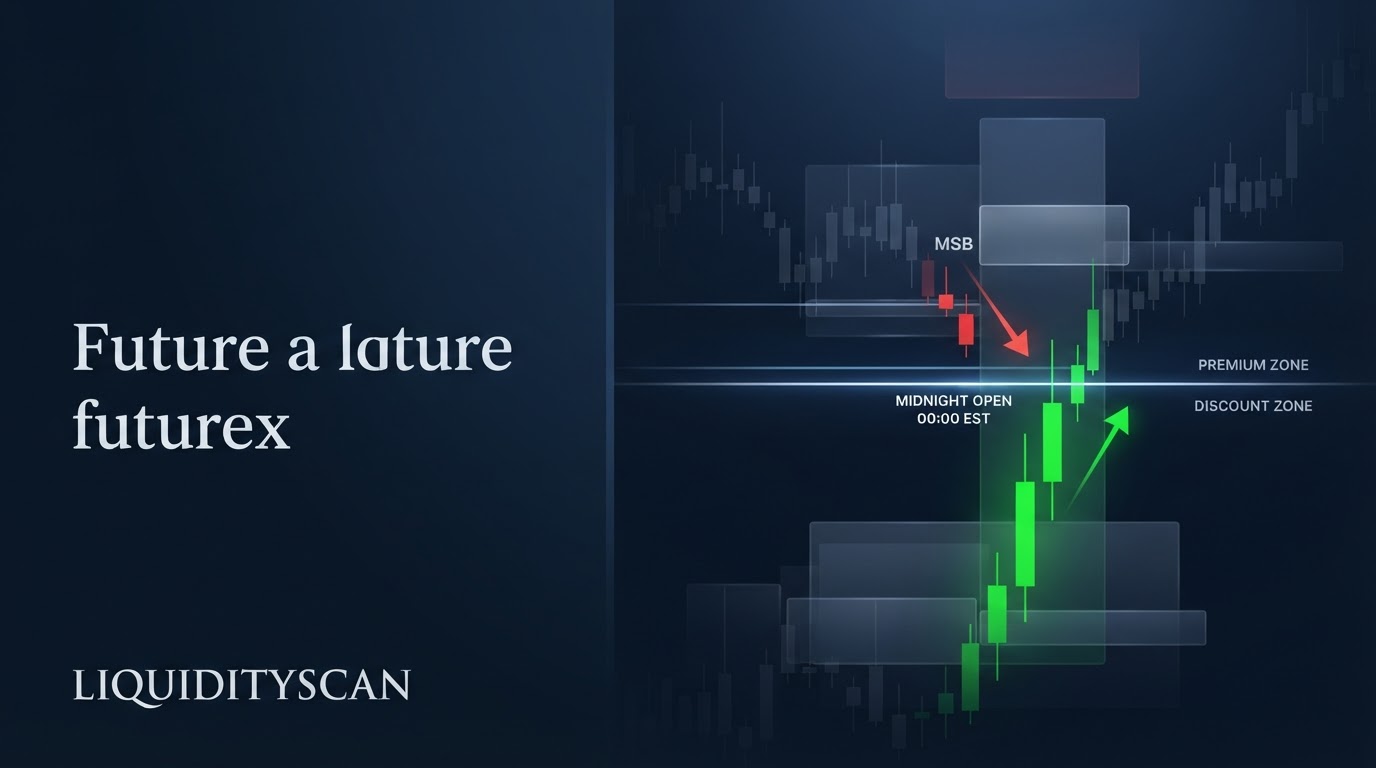
The Midnight Open in ICT: Why 00:00 EST Anchors the Daily Range
The ICT midnight open is the price at exactly 00:00 America/New_York — the reference the delivery algorithm uses to reset the trading day. It splits the session into premium above and discount below, framing your directional bias before London or New York moves.
Hayk Muradian·
·10 min

How to Calculate Position Size for an ICT Trade (Step-by-Step)
Position size = (account x risk%) divided by stop distance. Fix your dollar risk, measure the distance from entry to your structural invalidation, then divide. The stop sets the size, not leverage.
Hayk Muradian·
·10 min

Kill Zone vs Macro vs Silver Bullet: How ICT's Time Windows Nest
They are not competing tools. A kill zone is the 2-3 hour session window you watch, a macro is a ~20-minute run inside it, and the silver bullet is one macro-timed FVG setup that lives inside the kill zone.
Hayk Muradian·
·11 min

Does the Silver Bullet Strategy Actually Work?
The Silver Bullet can work, but not because of the clock. The one-hour window is only a filter. The real edge lives in HTF bias, a genuine liquidity sweep, and displacement into the FVG entry. Traded mechanically with no filters, it is mediocre.
Hayk Muradian·
·10 min
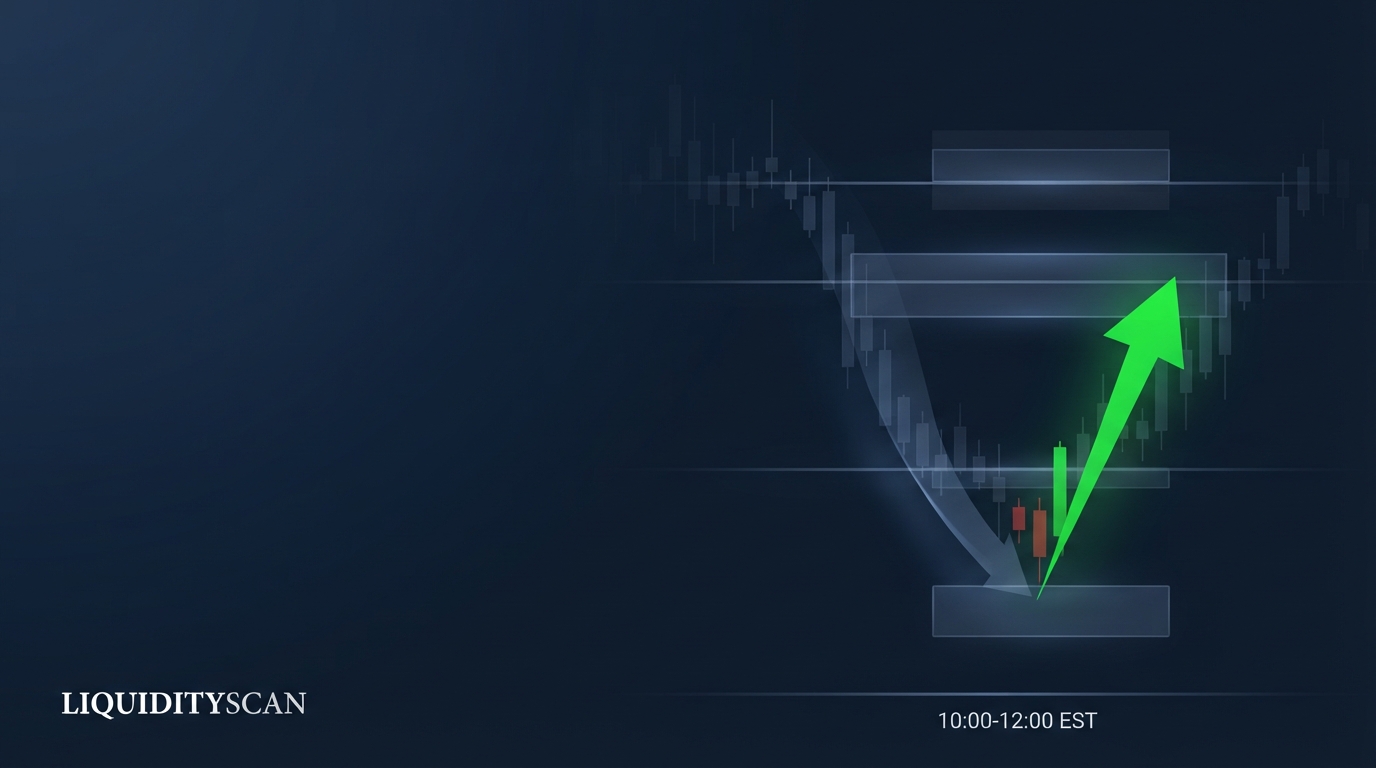
The London Close Kill Zone: How to Trade the 10-12 EST Reversal Window
The London close kill zone runs roughly 10:00-12:00 EST, when European desks square positions and the New York AM move often reverses toward equilibrium. It is a mean-reversion window, not a continuation one.
Hayk Muradian·
·10 min
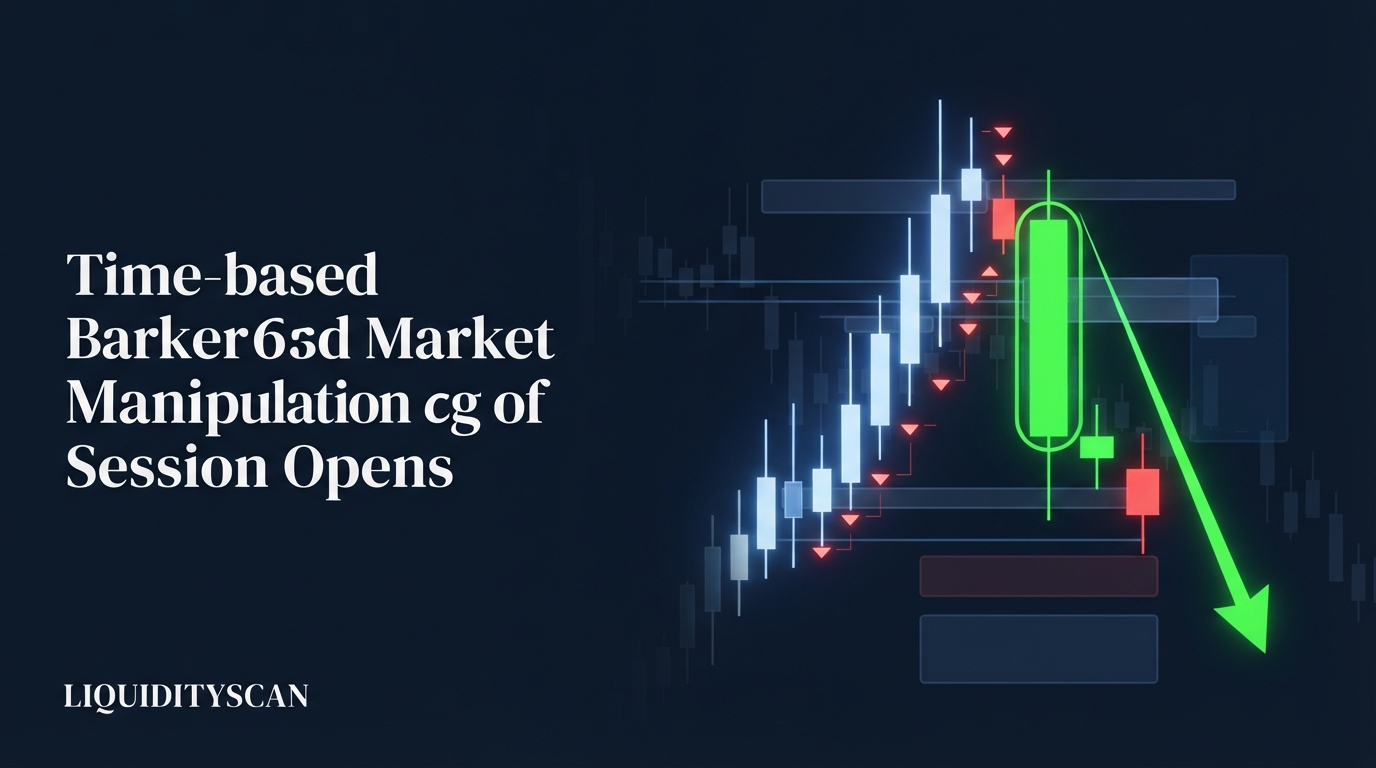
Why Does the Market Reverse Right After the Open? The Time-Based Manipulation Logic
The session open is the moment the most orders rest on the book — overnight stops, breakout orders, retail chasing the first candle. The algorithm runs an initial move to trigger that liquidity, then reverses toward the true daily direction. That false push is the Judas swing.
Hayk Muradian·
·10 min
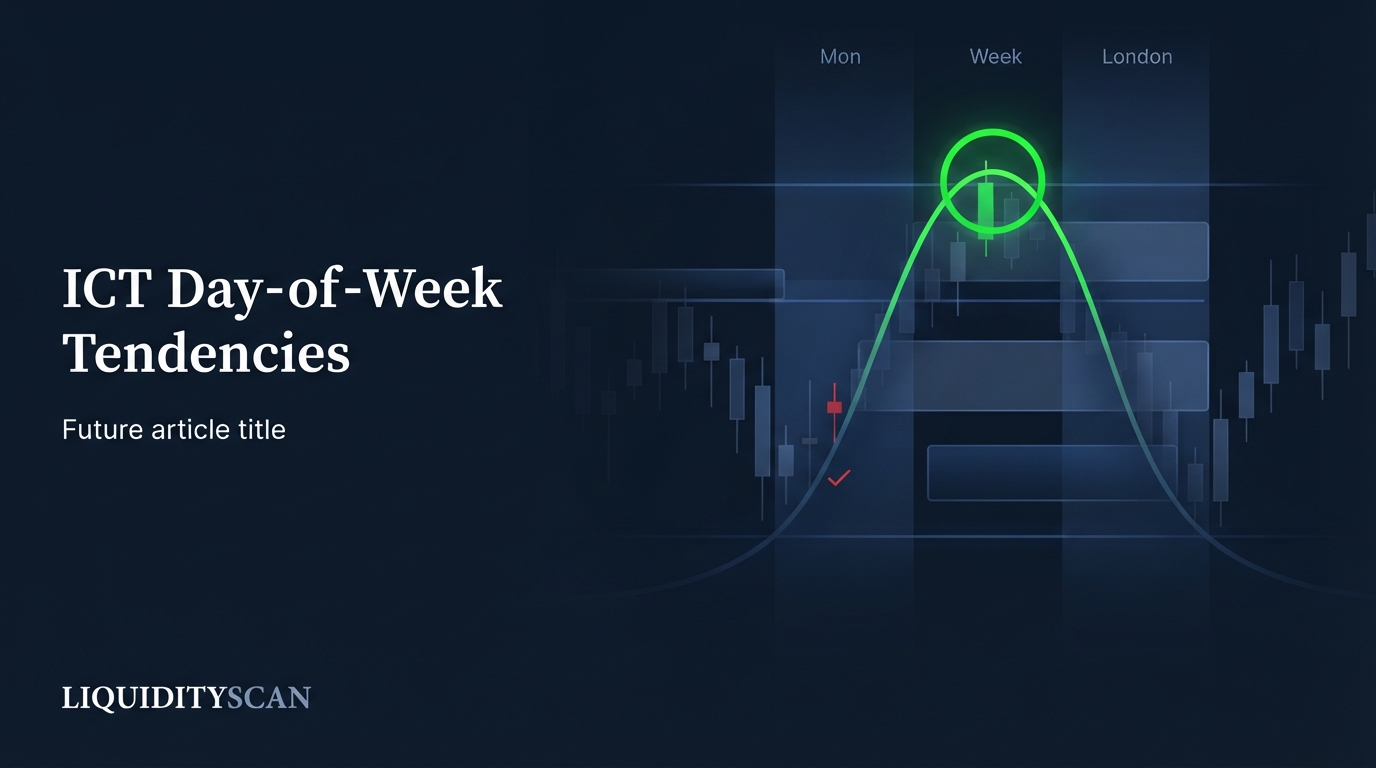
ICT Day-of-Week Tendencies: Why Tuesday and Wednesday Set the Weekly High or Low
In ICT, the weekly high or low tends to form on Tuesday or Wednesday during the London session — not Monday's quiet range or Friday's fade. Knowing when the weekly extreme prints lets you position toward the draw for the rest of the week.
Hayk Muradian·
·10 min
ICT Kill Zones: Definition & Liquidity Mechanics
ICT kill zones are the daily time windows where institutional order flow concentrates. Here's what they are and why they produce sweeps.
Hayk Muradian·
·4 min
Do ICT Kill Zones Still Work in 2026? A Data-Driven Reality Check
The volatility is real; the clock is not the edge. Session opens still concentrate institutional liquidity, but kill zones only produce expectancy when paired with HTF alignment and a liquidity narrative — not traded blindly by the hour.
Hayk Muradian·
·10 min
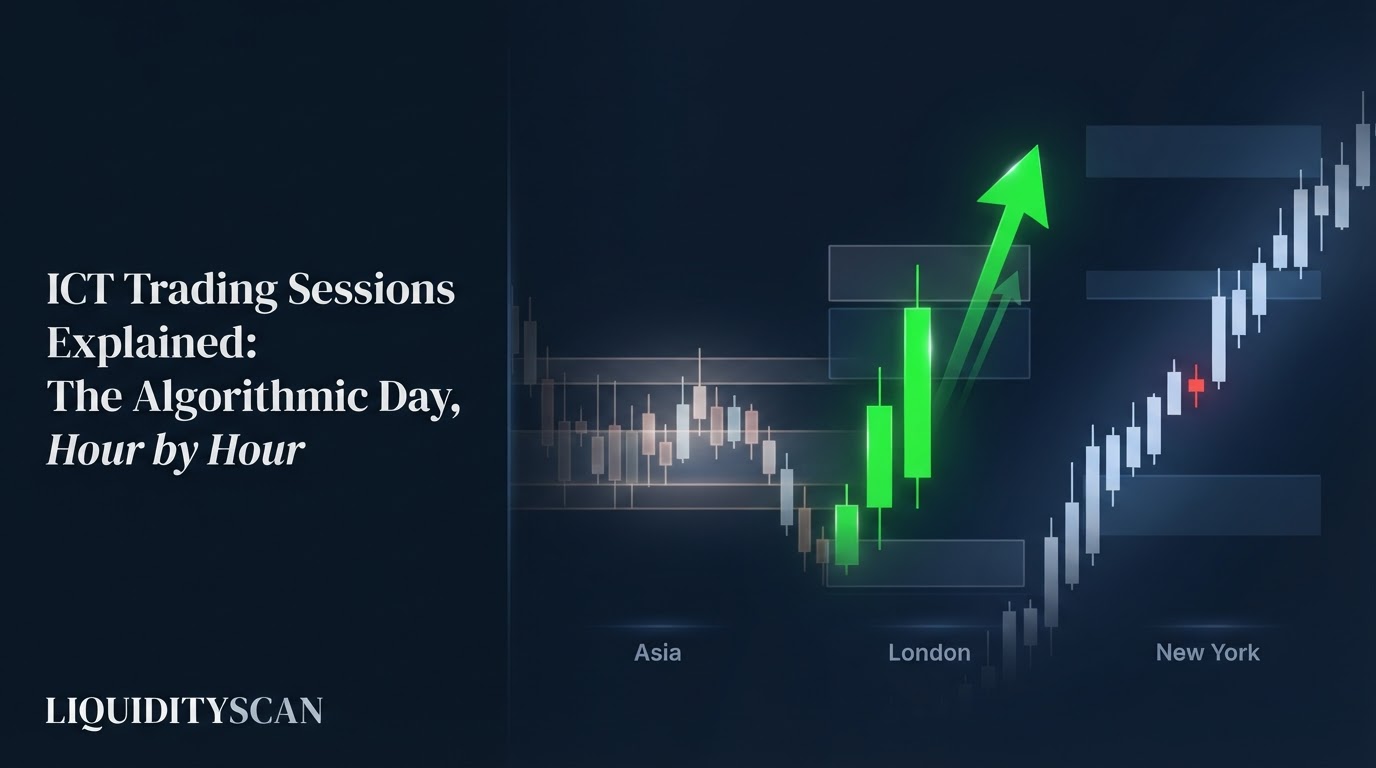
ICT Trading Sessions Explained: The Algorithmic Day, Hour by Hour
ICT trading sessions split the day into Asia, London, and New York blocks that each play a fixed role: Asia builds a range, London runs the first manipulation, and New York delivers the real move. Trade the schedule, not just the level.
Hayk Muradian·
·11 min
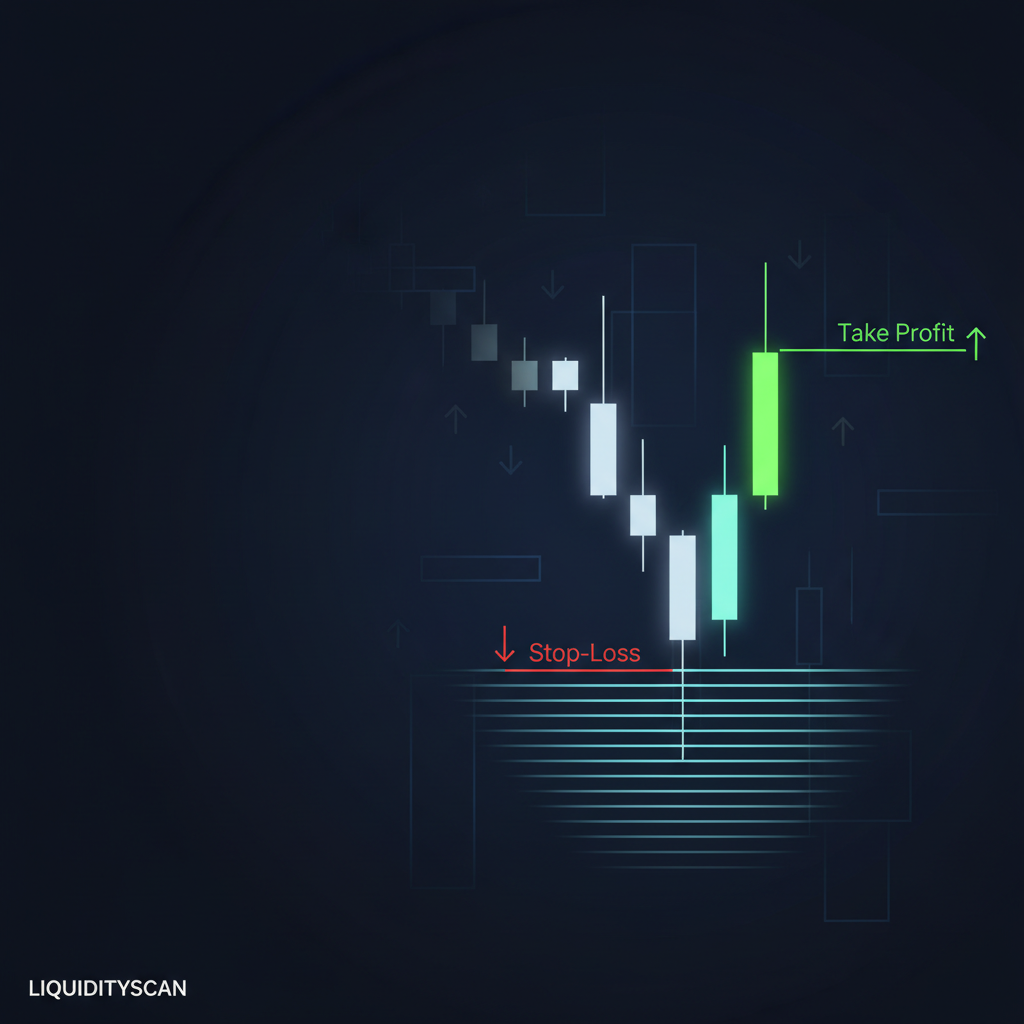
ICT Position Sizing: Stop Guessing Your Trade Size
ICT position sizing turns risk into a fixed input. Risk one percent, think in R-multiples, and let tight liquidity-based stops size the trade for you.
Hayk Muradian·
·4 min
ICT Time and Price: Why Your Level Keeps Failing
ICT time and price theory says a level only matters when it aligns with a timing window. Here is how the two halves combine into one clean setup.
Hayk Muradian·
·5 min
ICT News Trading: Discipline Around High-Impact Events
ICT news trading isn't about predicting the number. It's about letting NFP, FOMC and CPI run stops first, then reacting to structure.
Hayk Muradian·
·4 min
ICT vs Supply and Demand: Which Actually Works?
ICT vs supply and demand isn't a rivalry — they read the same imbalance, but ICT adds liquidity, timing, and an algorithmic narrative on top.
Hayk Muradian·
·5 min
Rejection Blocks: The Wick Zone Most Traders Ignore
A rejection block is an ICT zone built from long wicks that reject a swing high or low after a liquidity run. Here is how to read and trade it.
Hayk Muradian·
·4 min
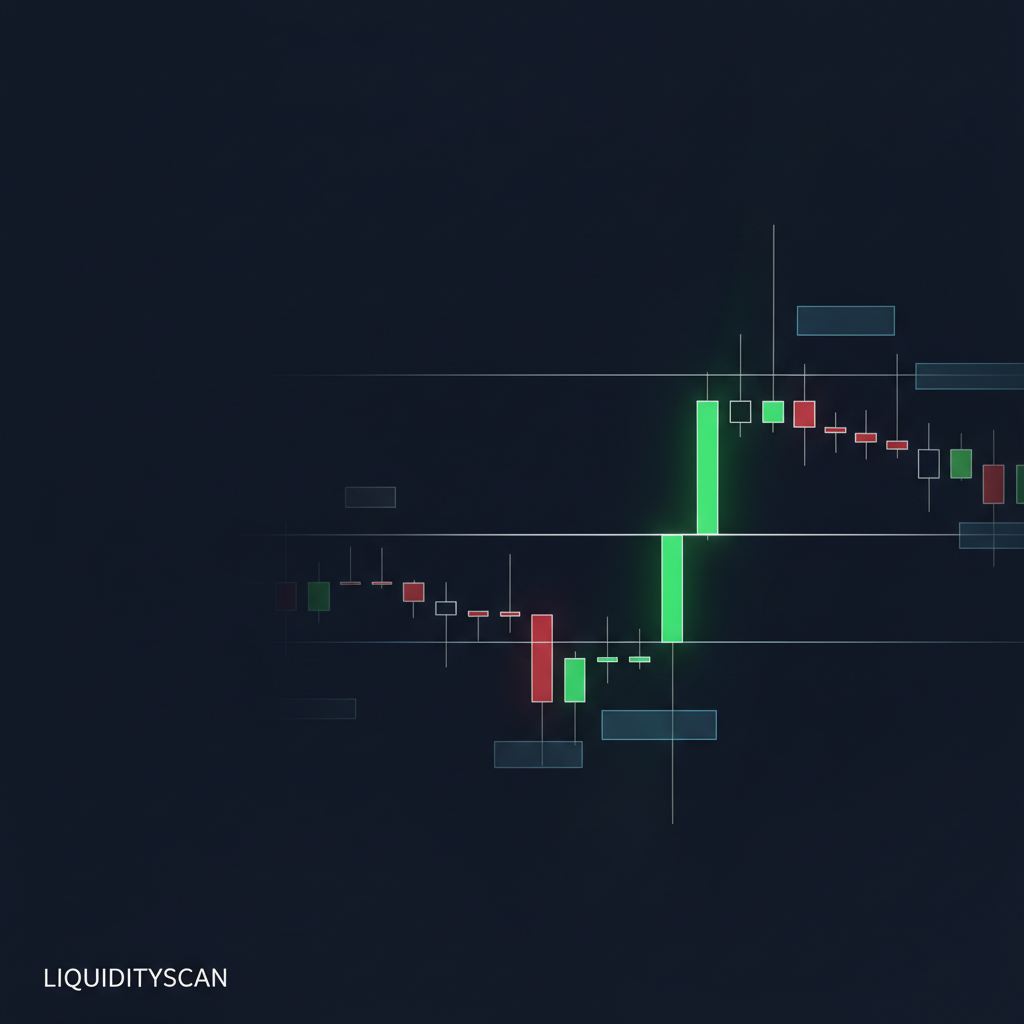
Displacement in ICT: Reading Institutional Intent
Displacement is the ICT footprint of institutional order flow: a fast, wide move that shifts structure and leaves a fair value gap behind it.
Hayk Muradian·
·4 min
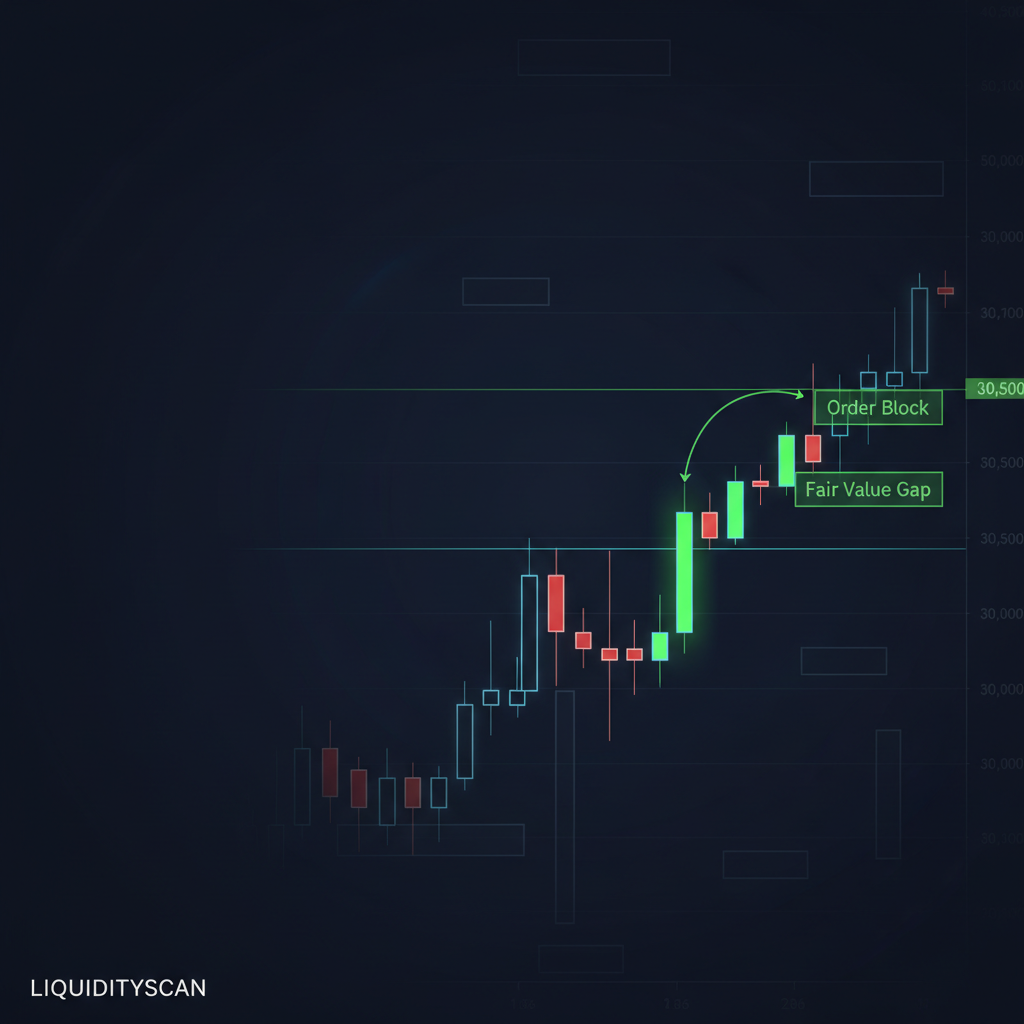
Does ICT Actually Work on Bitcoin? The Honest Answer
ICT crypto trading works on Bitcoin because the same liquidity mechanics drive price, but the 24/7 market forces you to adapt sessions and kill zones.
Hayk Muradian·
·5 min
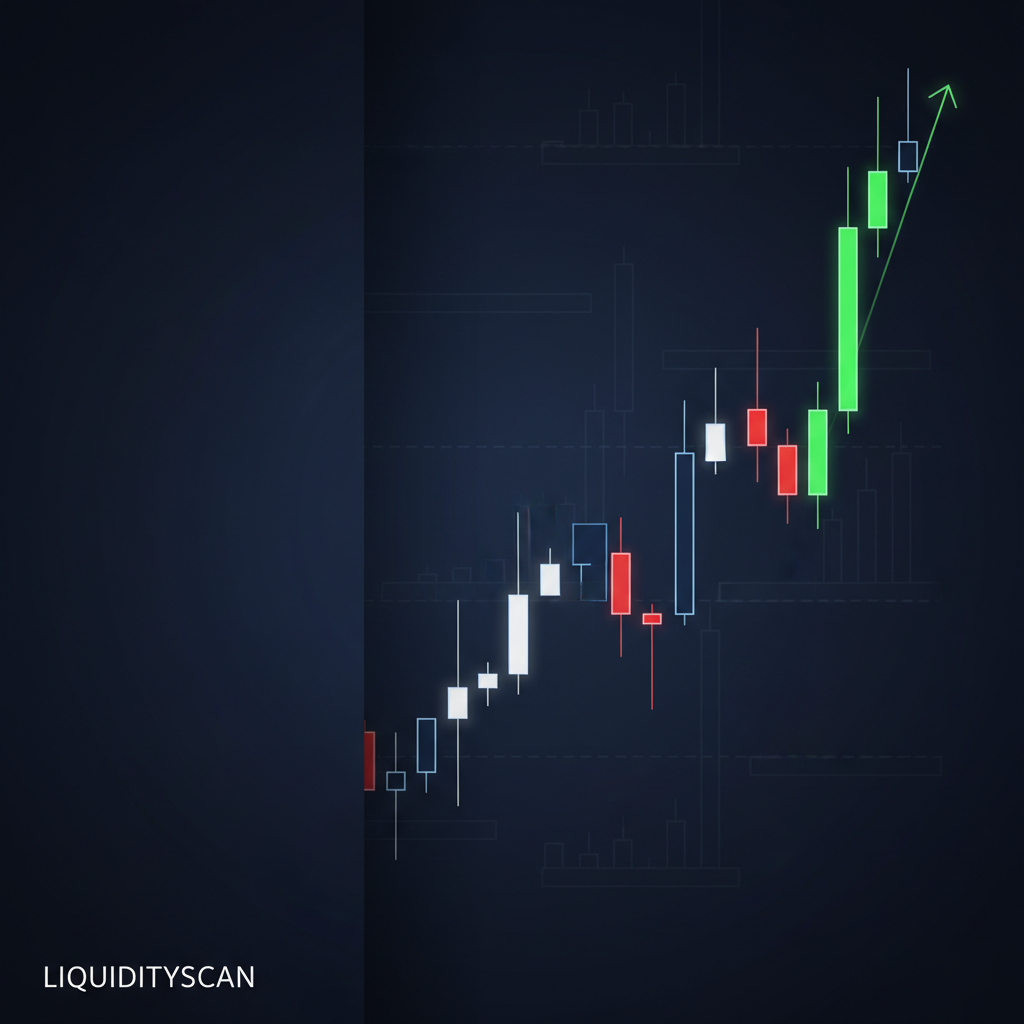
Propulsion Block: The ICT Continuation Setup
A propulsion block is an ICT continuation setup where price stacks on a fresh order block to power the next leg of a trend instead of reversing.
Hayk Muradian·
·4 min
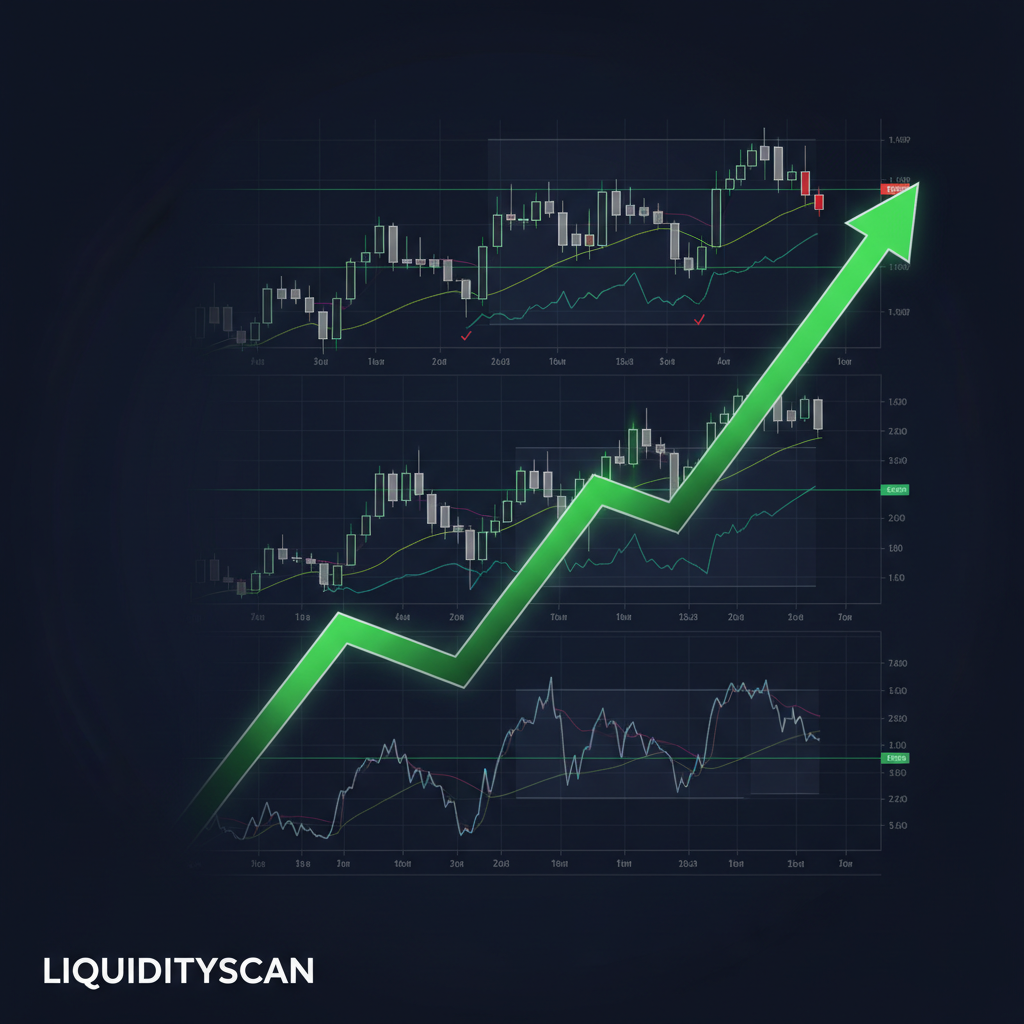
ICT Top-Down Analysis: Stop Fighting the Chart
ICT top-down analysis stacks timeframes so higher-timeframe bias, intermediate liquidity, and a refined lower-timeframe entry all point the same way.
Hayk Muradian·
·5 min
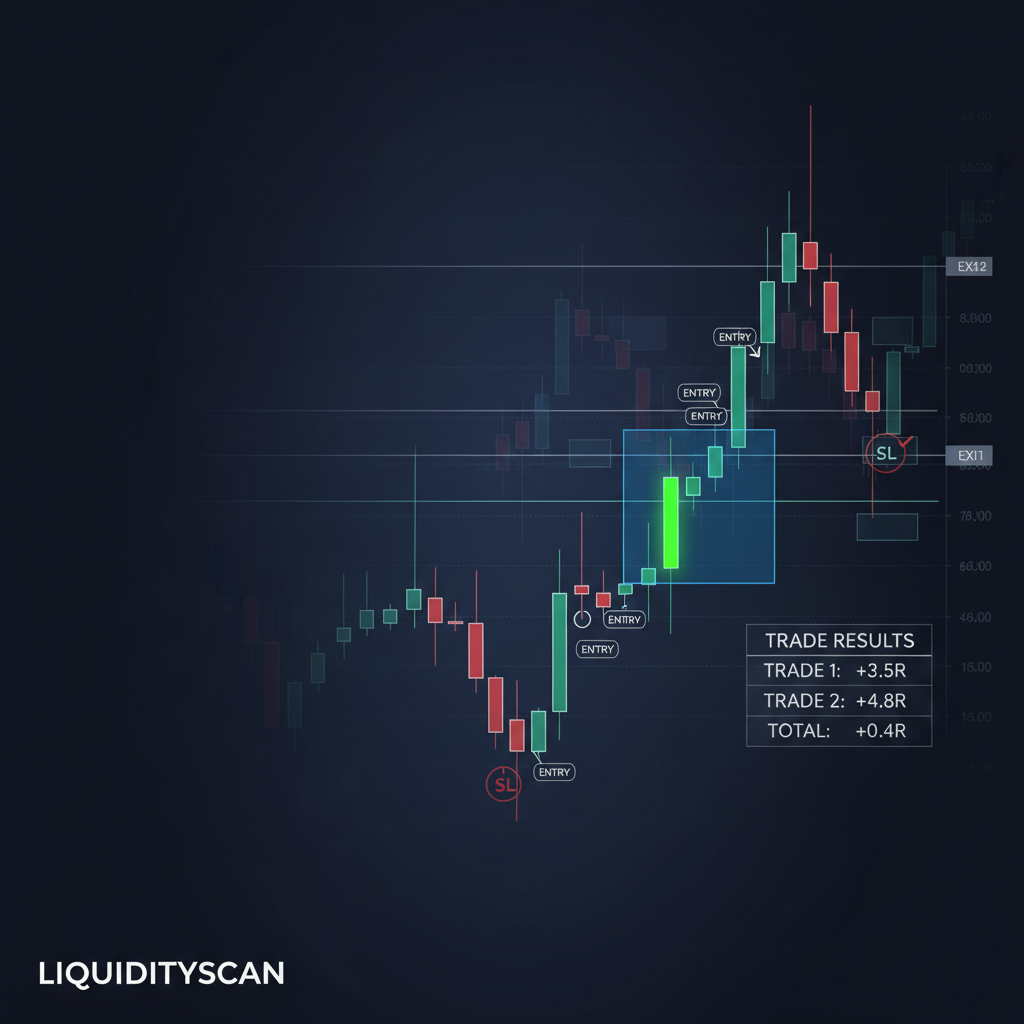
Backtest Your ICT Strategy Before It Costs You
A proper backtest turns "this setup feels good" into numbers you can trust. Here is how to backtest an ICT strategy without fooling yourself.
Hayk Muradian·
·5 min
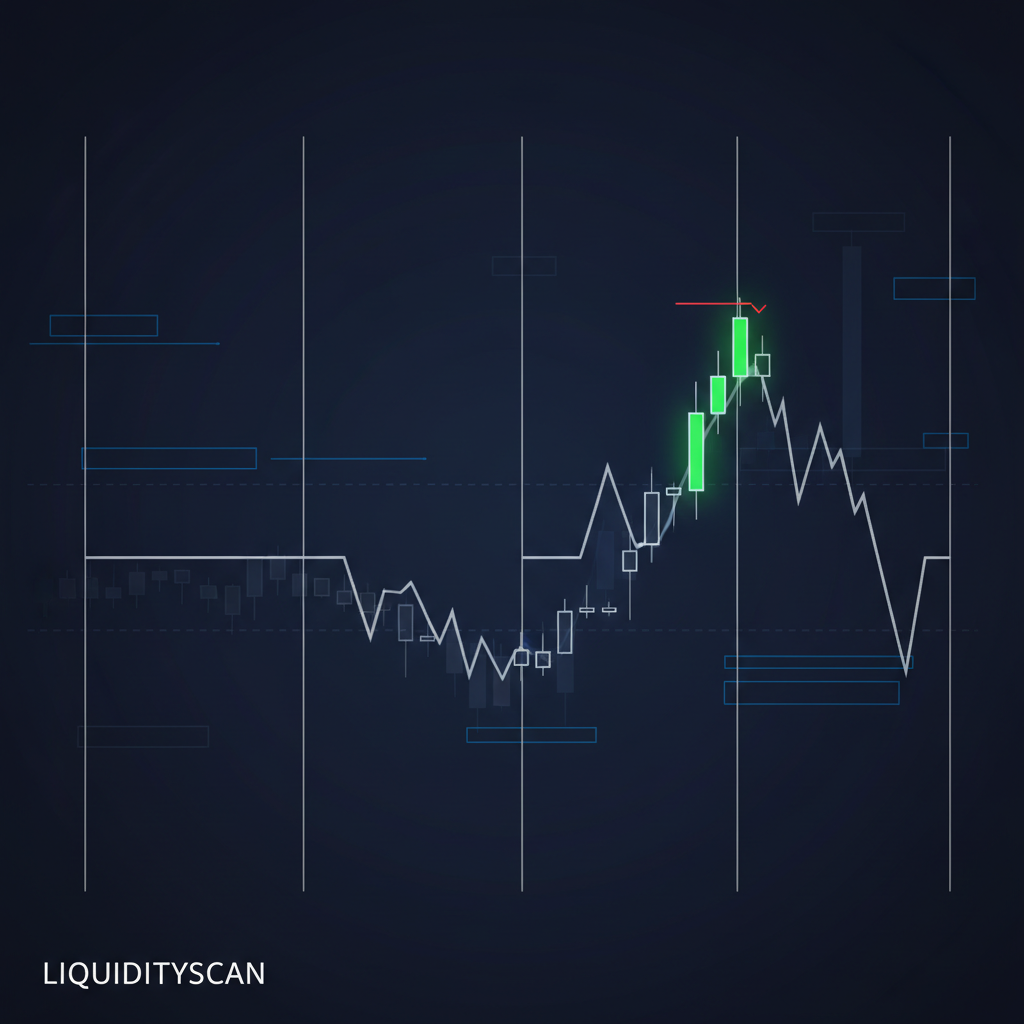
ICT Quarterly Theory Explained Simply (With Table)
ICT quarterly theory splits time into four repeating quarters. Learn the fractal cycles, the True Open reference, and how AMD unfolds inside each window.
Hayk Muradian·
·5 min

IPDA in ICT: The Algorithm Behind Price Delivery
IPDA is ICT's shorthand for an algorithmic price-delivery engine that seeks liquidity and rebalances inefficiency across defined lookback ranges.
Hayk Muradian·
·5 min

The ICT Unicorn Model: The Highest-Probability ICT Entry
The ICT unicorn model stacks a breaker block over a Fair Value Gap after a liquidity sweep and market structure shift for a high-probability entry zone.
Hayk Muradian·
·4 min
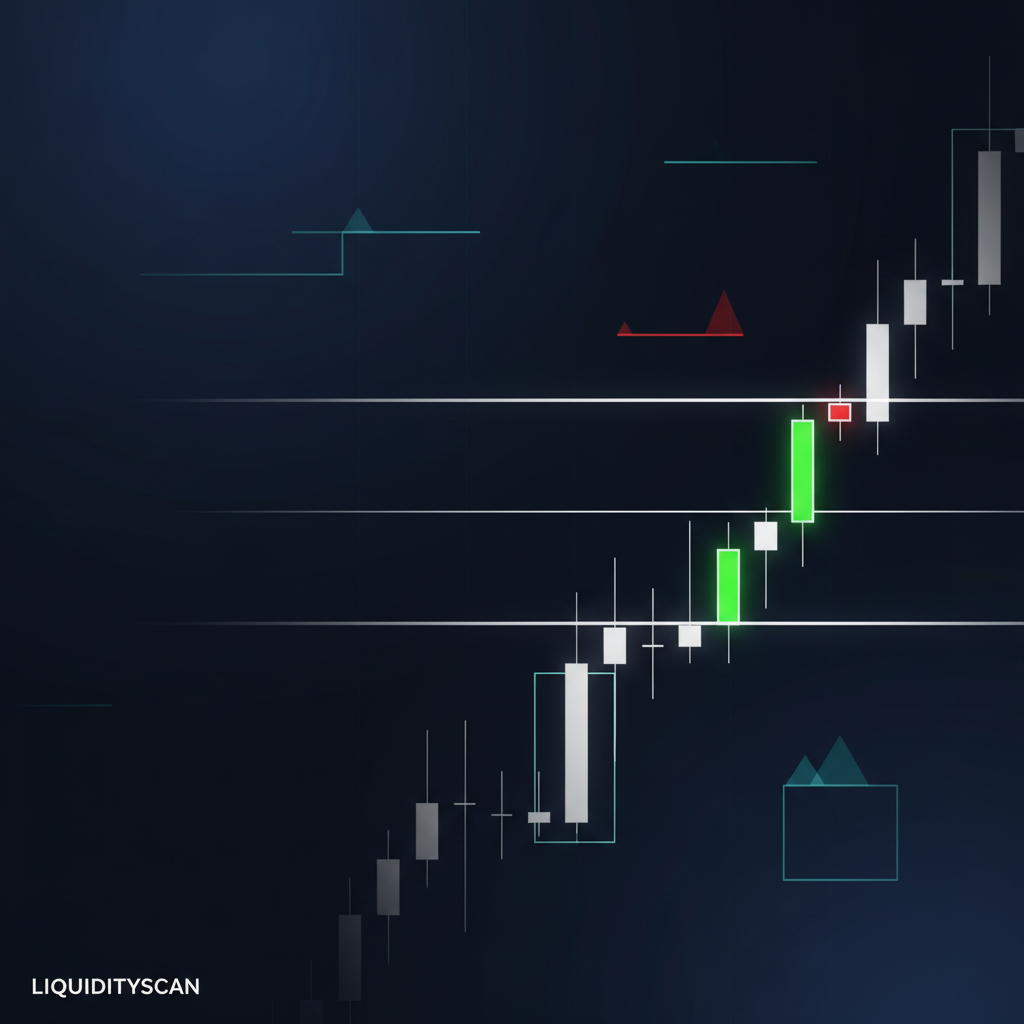
NWOG & NDOG: The Opening Gaps Smart Money Watches
The New Week Opening Gap and New Day Opening Gap are institutional reference points. Here is how ICT traders read and trade these opening gaps.
Hayk Muradian·
·5 min

Consequent Encroachment: The One FVG Level Pros Watch
Consequent encroachment is the 50% midpoint of a Fair Value Gap — the single price level ICT traders use to refine entries and place tighter stops.
Hayk Muradian·
·4 min
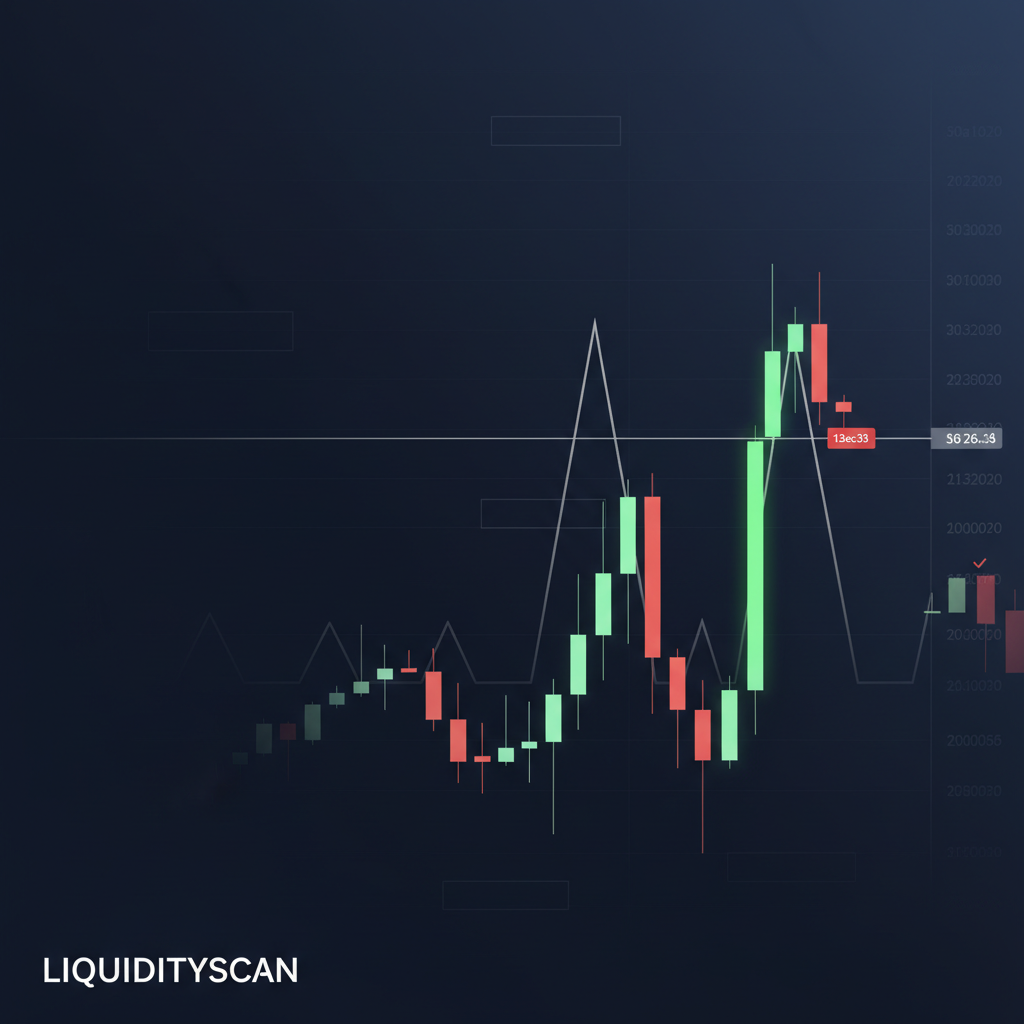
Equal Highs & Equal Lows: The Liquidity Trap
Equal highs and equal lows are matched swing points that stack resting stops, forming a liquidity magnet price is drawn to sweep.
Hayk Muradian·
·4 min

CBDR: Turn the Overnight Range Into Price Targets
The central bank dealers range (CBDR) turns a quiet overnight box into projected standard-deviation targets you can trade toward the next session.
Hayk Muradian·
·5 min

Balanced Price Range (BPR): The ICT Reversal Zone
A balanced price range is where a bullish and bearish FVG overlap, marking the exact zone ICT traders watch for institutional reversals.
Hayk Muradian·
·4 min
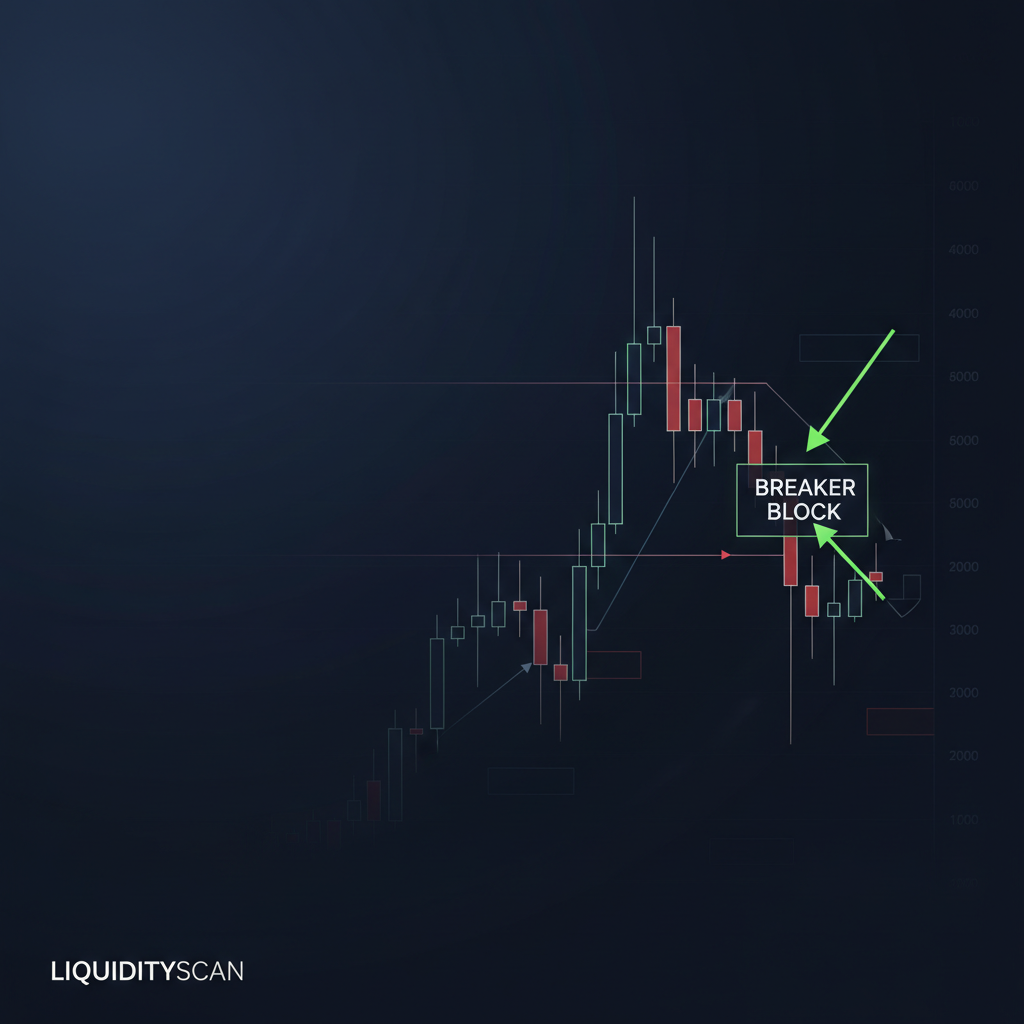
Breaker Block Explained: The ICT Reversal Entry
A breaker block is a failed order block that flips sides after price sweeps liquidity and shifts structure. Here is how it forms and how to enter.
Hayk Muradian·
·4 min
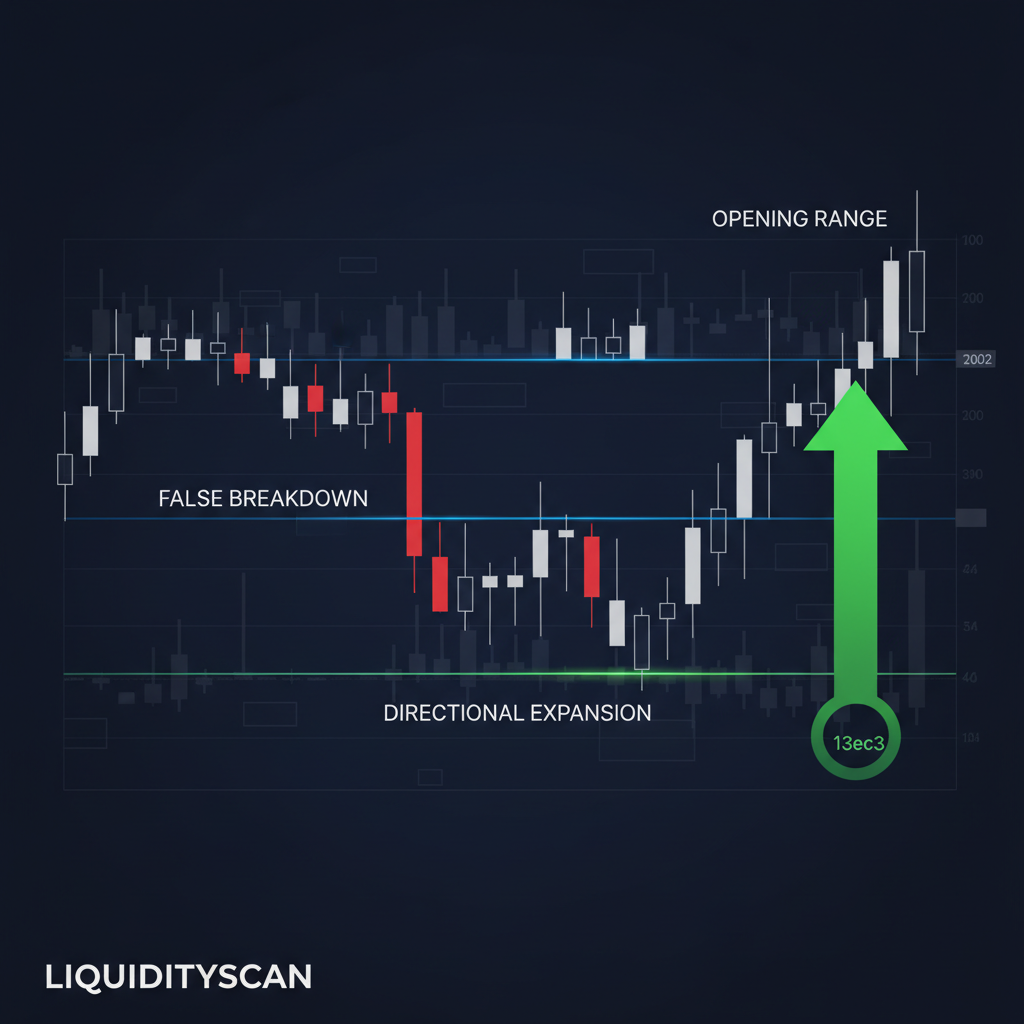
PO3 Explained: The 3 Phases Smart Money Uses Every Day
The Power of 3 (PO3) breaks every candle into accumulation, manipulation and distribution — the AMD rhythm that reveals where smart money moves next.
Hayk Muradian·
·5 min

ICT 2022 vs 2024 Model: Which One Should You Trade?
The ICT 2024 model refines the 2022 framework with time-based macros and new points of interest. Here is how they differ and when to use each.
Hayk Muradian·
·5 min
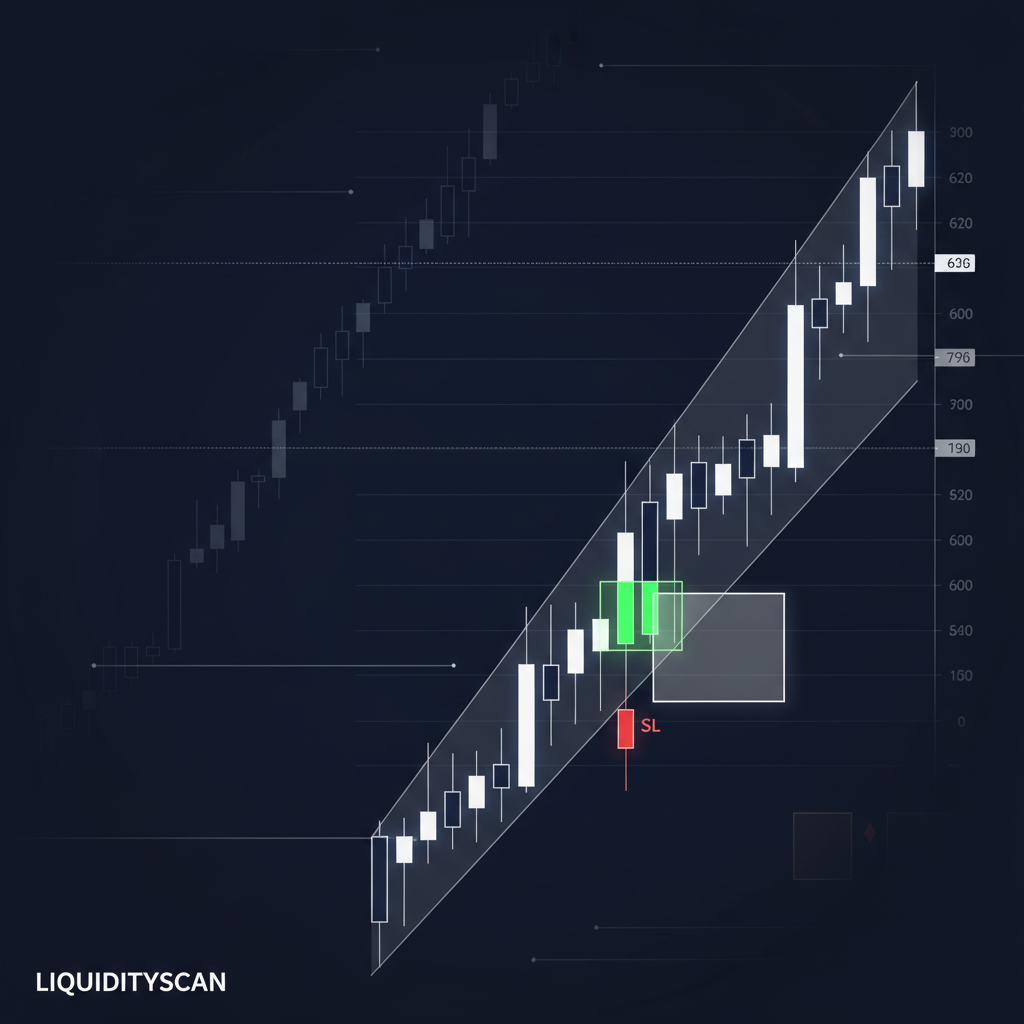
OTE: The Fibonacci Zone Institutions Enter On
Optimal Trade Entry is the ICT retracement zone between the 62% and 79% Fibonacci levels. Here is why price seeks it and how to use it.
Hayk Muradian·
·4 min
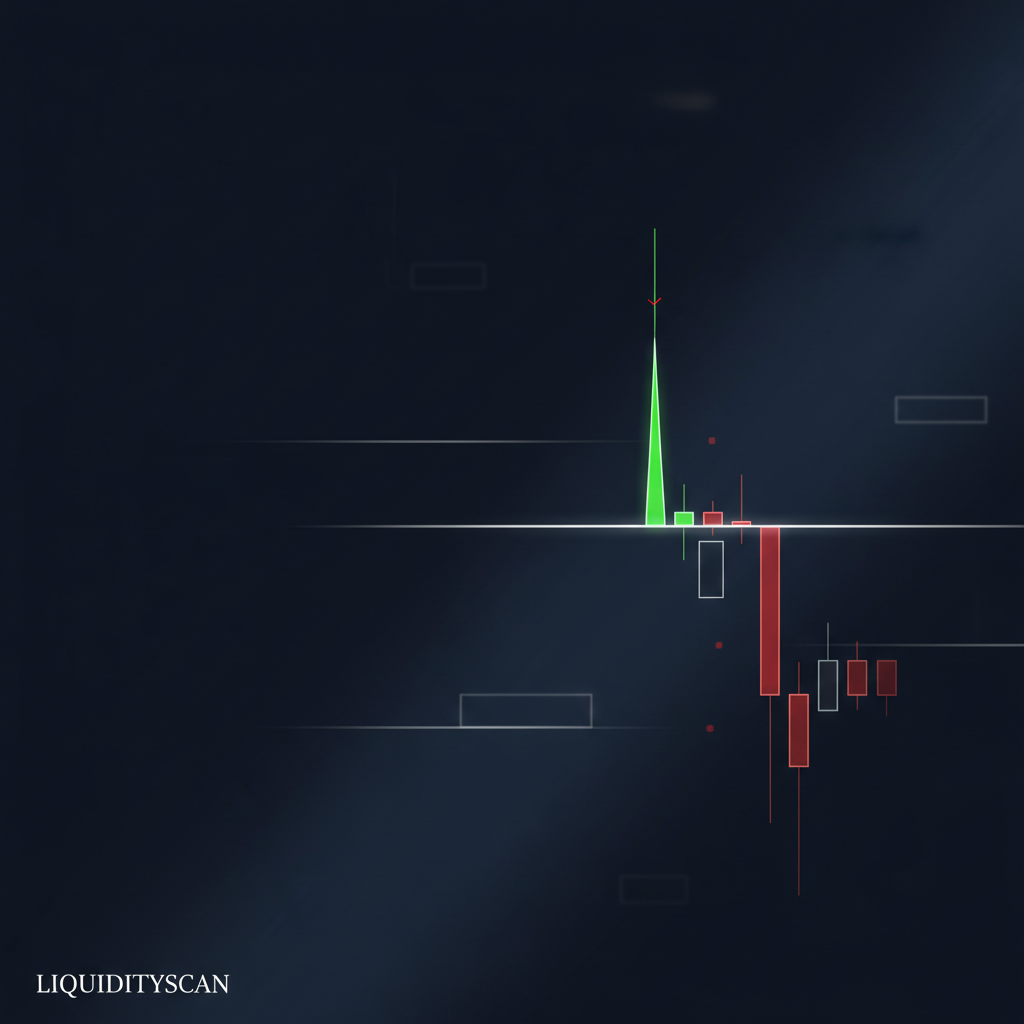
Liquidity Sweep: Why Price Hunts Your Stop Loss
A liquidity sweep is how institutions run resting stop orders at obvious highs and lows, then reverse. Here is how to spot a valid one.
Hayk Muradian·
·5 min
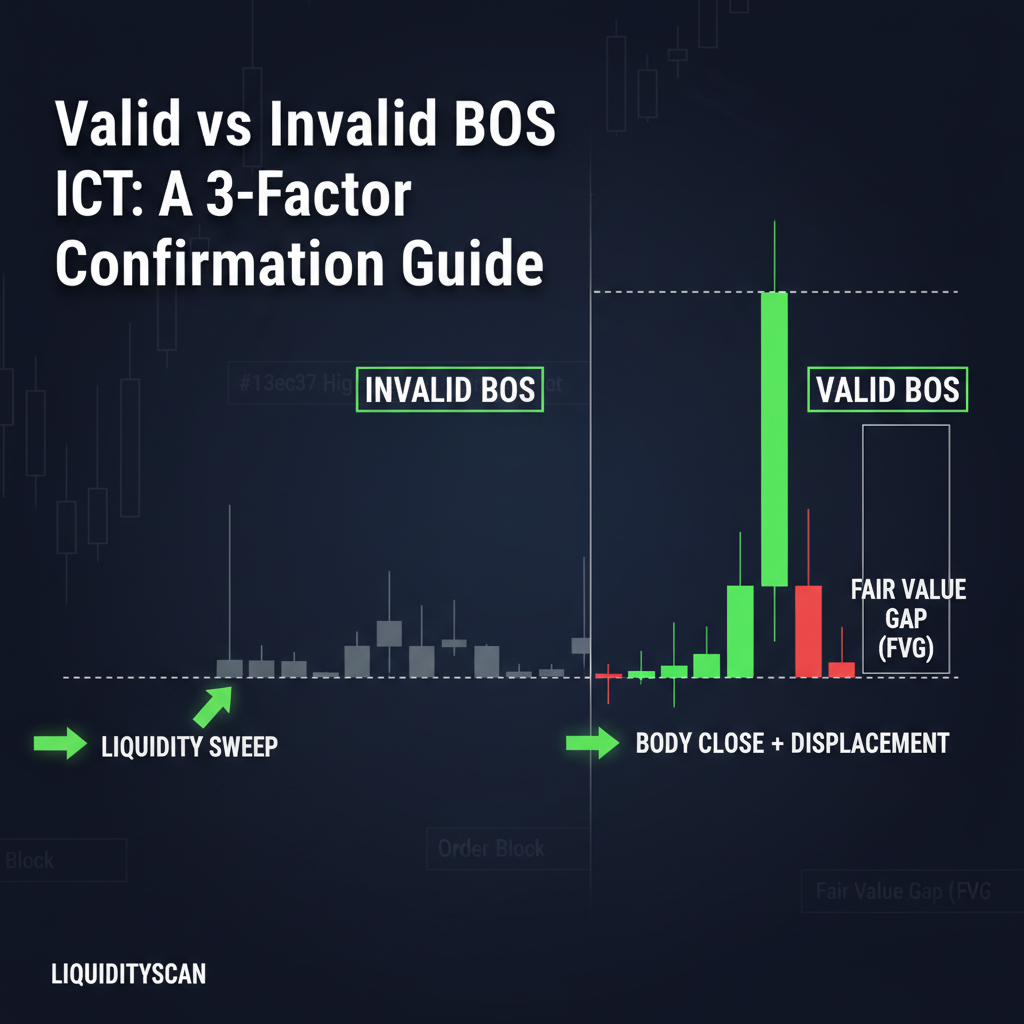
Valid vs Invalid BOS ICT: A 3-Factor Confirmation Guide
A valid Break of Structure (BOS) is confirmed by a candle body closing beyond a structural high or low with displacement. An invalid BOS is a wick-only sweep that fails to generate a subsequent Fair Value Gap.
Hayk Muradian·
·9 min
Not trading advice. LiquidityScan publishes educational content for informational purposes only. Trading involves substantial risk of loss.